Beginnings of the FED
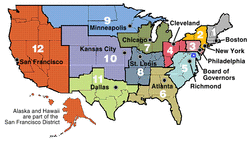
Now may be a good time to give a brief primer of the Federal Reserve Bank that is the central bank of the United States which was formed in 1913. The FED is not part of the US government, it is a private corporation that is owned by its member banks. If a bank has a national charter, they must belong to the FED and all banks must have deposits with the FED in part, to maintain adequate liquidity. The FED is broken into 12 districts (attached chart) and each district is run as a corporation with its own president and Board of Directors. Approximately every 6 weeks the Federal Open Market Committee (FOMC) meets to establish policy. The FOMC is comprised of 7 governors, and the 12 District presidents of which only 5 vote at any time; the president of the NY FED is always a voting member of the FOMC and is the vice chair (the NY FED has at least 25% of the FED's assets and has the largest repository of gold in the world). They meet on a Tuesday and Wednesday and generally make an announcement on Wednesday at 2 PM which can be market moving A very big advantage of the FED, is that it is an independent entity, and theoretically, is not subject to political influence. The FED is a private corporation and it's stockholders are its member banks which receive annual dividends. I feel very strongly, that if not for the actions of Ben Bernanke and the FED, we could have quite possibly have entered a 2nd depression as a result of the 2008 financial crisis.
Money Supply Part I
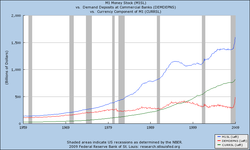
As a result of yesterday's update, I received a # of e-mails liking the FED's explanation and could I further expound. No problemo. One of the course's I teach is monetary theory and I have an entire text book full of info. Let's start with the money supply which is controlled by the FED. One of the ways they do this is by open market operations, more recently referred to as Quantitative Easing. After the Fed was formed in 1913, the way they earned money was by loaning money to member banks and charging them interest; this interest is referred to as the discount rate. They were profitable, but by the early 20's, they were looking for ways to make more money. They started buying and selling government bonds and they inadvertently discovered that they can control the money supply in this fashion. How does this happen? First, who owns US government bonds, virtually anyone; it is considered a no risk investment. Let's assume the FED wants to stimulate a sluggish economy; they do this buy expanding the money supply. They start to buy bonds: they buy Paul's bonds, Marks bonds Leslie's bond etc. The FED now owns the bonds, and Paul Mark and Leslie now have money they didn't have before, and hence, the money supply is expanded. What do Paul Mark and Leslie do with the money. Mark spends all of it and Paul and Leslie spend some (consumption) and save some; however, it is the extra consumption because of the expanded money that stimulates the economy.
Money Supply; part 2
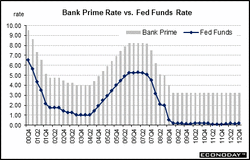
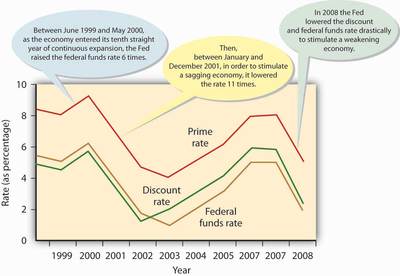
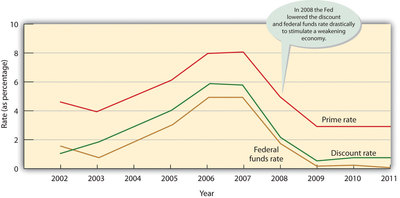
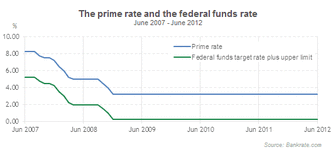
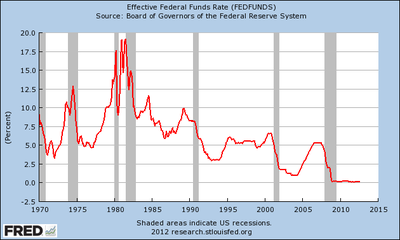
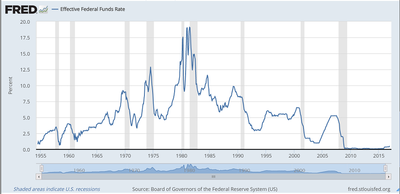
In a previous stock pick, we talked about how the FED changes the money supply by buying and selling US Government bonds referred to as open market operations (see FED speak this web site). There are also two other ways that they can do this. One is by changing the Federal Funds rate and this rate affects all other short term interest rates. The federal funds rate is that rate of interest that one bank charges another on overnight loans. When this rate is changed, it also immediately affects all other rates, the 1st being the prime rate. The prime rate is the rate that the largest banks, charge their best customers on short term loans and it is usually about 3% above the prime rate. As consumers, this concerns us because this affects a Home Equity Line of Credit (HELOC) loan which is usually the same rate as the prime. If you own a home (over 65% of households do) and are not familiar with a HELOC you should be since it can be a significant cost savings alternative to other forms of loans. A bank will look at the equity you have in your home (the value of a home less what you owe) and loan you, anytime you want, up to 75% of that amount. You can use this in various ways such as home improvements or buying a car. A HELOC has two big advantages over say a car loan; it is at a lower rate of interest and the interest is tax deductible because it is a form of home loan.
By the FED lowering interest rates, the cost of buying assets on credit is cheaper, more people take loans, and as a result, more money (in the form of checkable deposits) circulates throughout the economy.
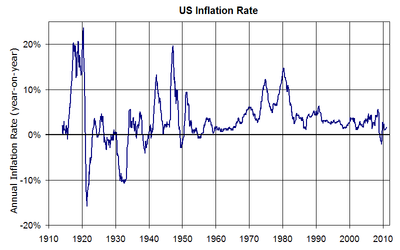
The FED is also accused of taking away the punch bowl when the party is going the wildest. One of the FED's main enemies is inflation, and if they feel it is getting out of control (usually above 3%) they can increase the Federal Funds rate which has just the opposite effect as explained above.
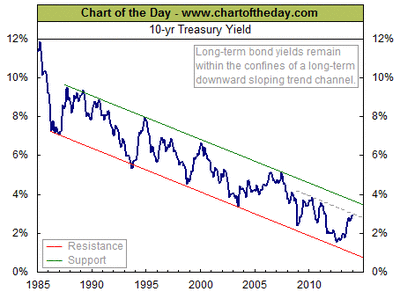
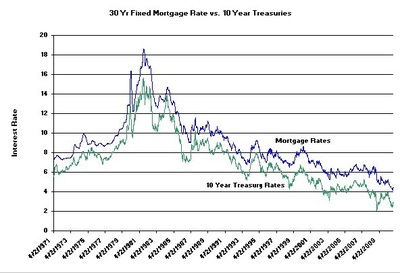
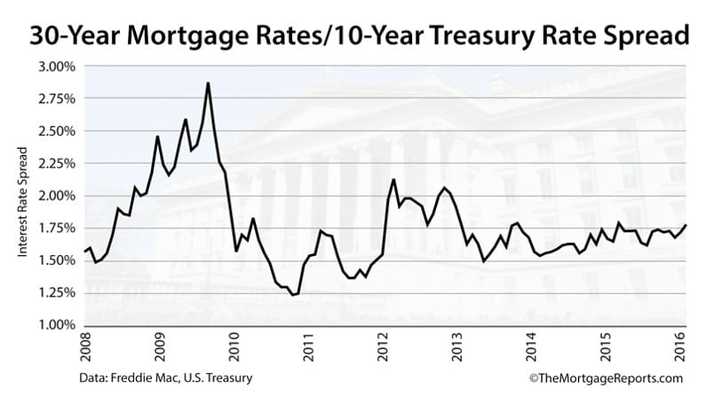
Keep in mind, the FED controls the Federal Funds Rate and this affects short term interest rates. Mortgage rates are generally tied to the yield on the 10 year bond, and since there is a sell off in the bond market, the yield, and hence mortgage rates are increasing.
Money Supply Part 3
The third way that the FED controls the money supply is by use of the Reserve ratio. Reserve requirements are the amount of funds that a depository institution must hold in reserve against specified deposit liabilities. Within limits specified by law, the Board of Governors has sole authority over changes in reserve requirements. Depository institutions must hold reserves in the form of vault cash or deposits with Federal Reserve Banks. Since 1987, all banks, whether they belong to the Federal Reserve system or not, must have reserve deposits with the FED to insure adequate liquidity. Since 2008, the FED has paid interest on these reserves and excess reserves. The reserve requirements are as follows as of 12-22-2012:
$0 to $12.4 million 0%
$12.4 to $79.5 million 3%
More than $79.6 10.5%
When the FED increases the reserve ratio, it decreases the money supply since banks can't use that reserve money to lend to the public and vice versa.
$0 to $12.4 million 0%
$12.4 to $79.5 million 3%
More than $79.6 10.5%
When the FED increases the reserve ratio, it decreases the money supply since banks can't use that reserve money to lend to the public and vice versa.
The US debt made Simple
Debt/Fiscal Cliff
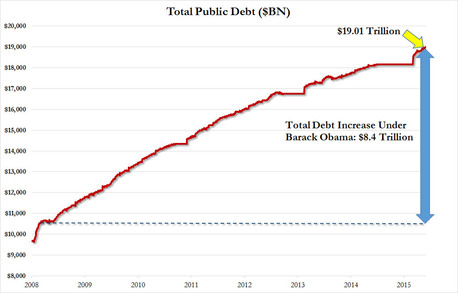
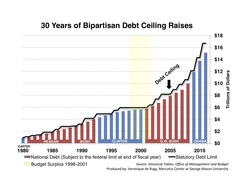
Here's a novel way to look at the debt that I recently received in an e-mail and after I checked the numbers, and adjusted some, they are as follows:
US Tax Revenue $2,710,000,000,000
Federal Budget 3,820,000,000,000
New Debt 1,110,000,000,000
National Deficit 17,039,000,000,000 at the time of this writing (Oct 2013)
Recent budget cuts 38,500,000,000
Let's now remove 8 zeros and pretend it's a housing budget
Annual family Income $27,100 (poverty level for a family of 4 is 23,550)
Money the family spends 38,200
New debt on Credit cards 11,100
Outstanding Credit card balance 170,390
Cuts in family Spending 38.5
This family would be in bankruptcy and oh yes, qualify for free Obamacare!
Interest Rates
Earlier today on CNBC, one of the commentators mentioned that the FED will keep interest rates low for an extended period of time, while another analyst stated that a drag on the economy and market, is the rising rate on mortgages. Why the disparity and who's wrong. Actually, they are both correct. The Federal Funds Rate (the rate one bank charges another bank on an overnight loan) affects short term interest rates. When the Federal Fund rates changes, it directly affects the Prime Rate. The Prime Rate is the rate the largest banks charge their best customers on short term loans. The prime rate is generally 3 points higher than the Fed Funds rate and that in turn affects all other short term loans such as: car loans, personal loans, boat loans and HELOCS (Home Equity Line of Credit).
Yield on the 10 Year Government Bond
The government finances it's deficit by borrowing money and it does this by issuing bonds that have a maturity value anywhere from 30 days to 30 years. Technically, Treasury bills are issued for terms less than a year.Treasury notes are issued in terms of 2, 3, 5, and 10 years and
Treasury bonds are issued in terms of 30 years. The price of a bond is inversely related to its yield and the mortgage rate is usually 2-3% higher than the 10 year yield.
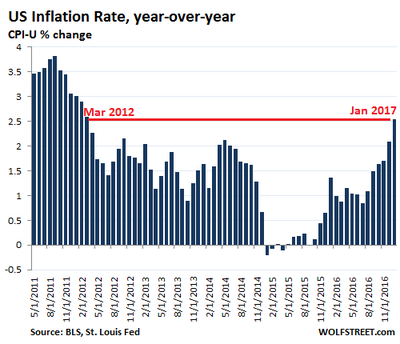
There are a number of sayings on Wall street, such as "Don't fight the FED", (see 7-18's update), and "The FED is known to take away the punch bowl, just as the party is at it's wildest". Currently the Federal Funds rate (see FED Speak) is at .25%. What does this mean to you? The Federal Funds rate (the rate one bank charges another on an overnight loan), affects all other short term interest rates, such as the Prime Rate (the rate big banks give their best customers on short term loans), Home Equity Line of Credit (HELOC's), car/boat loans, personal loans and interest rates on CD's and savings. In other words, as rates increase, so too does the cost of borrowing money (savers also realize greater earnings). What of mortgage rates (long term loans)? Mortgage rates are usually 2-3% higher than the yield on the 10 year government bond (see chart below), and while not always, they usually follow short term interest rates. The yield on any government bond is inversely related to its price; in other words as the price of the bond decreases (usually as a result of inflation fears), the yield increases. The reason why the FED would raise rates is inflation, and right now the FED is signalling that they are going to raise interest rates in mid 2015. If you look at the chart bottom left, interest rates and inflation appear to move in unison, this is known as the Fisher Effect and is not surprising. As the inflation rate increases, (FED policies are data driven), the FED increases interest rates, thereby making borrowing more expensive, and slowing down an overheating economy and putting the breaks on inflation.
GDP
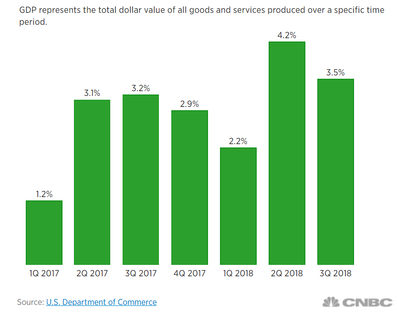
GDP, Gross Domestic Product, is a measure of a nations growth. It is the value of all final goods and services produced in an economy in a calendar year. If you purchase a used good, such as a pre-owned car or an existing house, that is not included in GDP since they were already counted in the year they were built. Notice in the definition, it states final goods good and services. For example, if I go out and buy a new set of tires for my car, that is counted in GDP. However, if GM buys a new set of tires for one of its chevy's on the assembly line, it is not counted. The reason being is that the selling price of the car is counted, and if the tires were counted, that would be double counting. In this case, the tires would be an intermediate good and intermediate goods are not part of GDP. Historically, quarterly increases in GDP are slightly over 3%. Quarter 1 was revised down to 1.1% from 1.8%, and initial figures for quarter 2 are 1.7%. there ware generally 2 revisions for any given quarter. You may be asking yourself, if growth is so poor, and unemployment is so high,7.6% for June, why is the Dow at record highs. Very simply, profits. Companies are doing more with less. As a result of Obamacare and Dodd-Frank, we are at or near regulatory recessions. Companies, particularly smaller companies, are hesitant to hire because of the added costs imposed by these regulations and they are doing more with less. During a recession and poor economic times of growth, labor productivity typically increases. The reason being is that managers lay off their least productive workers, and generally speaking, those remaining work harder because they don't want to go in the next round of layoffs
Consumption
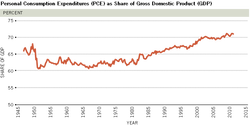
The largest component of GDP is consumption which comprises 70% of GDP, and in turn there are three components to GDP: Durable goods, non-durable good and services. The largest segment is services which comprises 60% of consumption. The way we measure what is happening in the service sector is by the ISM (Institute for Supply Management) service report, also called the Non-Manufacturing index report. The report for July came in today at 56, more than 3 points higher than June and far surpassing expectations. Anything higher than 50 shows that the sector is expanding, 50 shows level output and anything below 50 is indicative of a contraction. The 16 non-manufacturing industries reporting growth in July
— listed in order --
are: Arts, Entertainment & Recreation; Construction; Information; Wholesale Trade; Retail Trade; Finance & Insurance; Real Estate, Rental & Leasing; Agriculture, Forestry, Fishing & Hunting; Utilities; Educational Services; Other Services; Management of Companies & Support Services; Professional, Scientific & Technical Services; Accommodation & Food Services; Public Administration; andTransportation & Warehousing. The two industries reporting contraction in July are: Mining; and Health Care & Social Assistance.
The other two components are Durable goods which comprise about 12% of consumption and non-durable goods which comprise 28%.
Exchange Rates
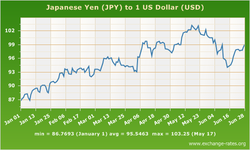
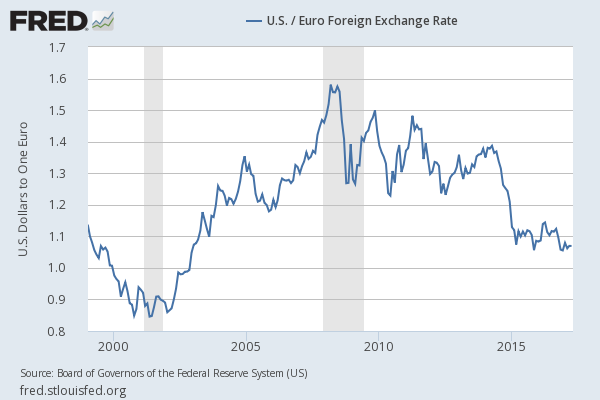
One of the questions I like to ask my students is,"What's better for the economy, a strong dollar or a weak dollar"? It's somewhat of a trick question, the correct answer is what the markets determine. Currencies, like other commodities, trade on a worldwide market and like other commodities, it will fluctuate. As you can see from the chart at the left, in the past year the yen has changed from 87yen to the dollar, to over 100 yen. So since it requires more yen to purchase a dollar, the dollar has gotten stronger in relation to the yen; however back in the 70's, it took 300 yen to purchase a dollar, so in the past 30 plus years (the long run), the dollar has weakened in relation to the yen. Why? There are a number of factors that affect exchange rates. The going interest for government bonds in one country in relation to other companies (interest rates have increased in the US, as a result, you can make more money from US government bonds), the economic and geopolitical stability of a country, and most importantly, trade with another country. If we buy Japanese goods, we need Japanese yens; and if there is a greater demand for Japanese goods from Americans than American goods from Japanese, then there is a greater demand for yen, and as a result, the dollar weakens. Why then is a weak dollar good for Wall st(businesses) but bad for Main st(consumer and vice versa? Let's assume for a minute that the Canadian dollar exchange rate is the same, in other words, one dollar Canadian equals 1 dollar American. I, an American citizen, go to Dunkin donuts in Canada and buy a coffee for one dollar Canadian, with the exchange rate at par (the same), it only cost me $1 American. However, for whatever reason, the American dollar weakens in relation to the Canadian dollar; it now takes 1.10 American to get one Canadian dollar. Let's also assume that prices in both Canada and the US have stayed the same (i.e., no inflation). I once again go to the Dunkin Donuts in Canada and pay $1 Canadian for the coffee. However, in order to get that Canadian dollar, it costs me $1.10 American. Therefore, the weakening dollar has made foreign goods (Canadian in this example) more expensive. Now the Canadian citizen goes to an American Dunkin Donuts and buys a coffee for $1 American, It only cost the Canadian 91 cents Canadian
($1.10 American = $1Canadian, if I divide each side by$1.1 I get $1American = .91 Canadian). As a result, American goods have become LESS expensive for the Canadians. This is why a weak dollar is good for Wall st (American goods are cheaper to other countries) but bad for Main st (foreign goods, like Honda's, are more expensive to Americans).
Right away some of you may be thinking, I want a strong dollar since I'm a consumer. Stop right there. Approximately 50% of all sales of businesses on the S&P 500 are to foreign countries; you read that correctly, 50%. So if our goods become less expensive, businesses are now able to hire more people, profits and dividends are generally higher and we, the consumer, benefit. Conversely, if the dollar gets stronger, our goods become more expensive, sales/profits drop, and layoffs can follow. So what's good for the economy, a strong or weak dollar, whatever the markets determine.
Phillips Curve Theory
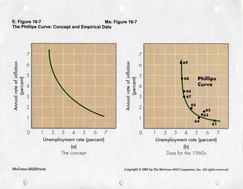
The attached chart is Phillips curve theory, essentially it states that unemployment and inflation are inversely related (to all my students, please take notice for test 1). The logic is as follows: If unemployment goes down, more people are working, making money and spending money. When a lot of consumers are spending, they will be some shortages. When you have shortages, price typically increases, and hence, inflation and inflation is a prime enemy of the Federal Reserve and they combat this by raising interest rates. This why the FED is accused "Of taking away the punch bowl when the party is at its wildest".
In pre-market trading, the Dow is up 16 points and Tesla is up 8 points on yet another upgrade.
Something to think about, the Social Security Administration is predicting 70 million retirees by 2020. That's comes out to 10,000 baby boomers/day are retiring. How do you spell labor shortage.
In pre-market trading, the Dow is up 16 points and Tesla is up 8 points on yet another upgrade.
Something to think about, the Social Security Administration is predicting 70 million retirees by 2020. That's comes out to 10,000 baby boomers/day are retiring. How do you spell labor shortage.
The Natural Rate of Unemployment
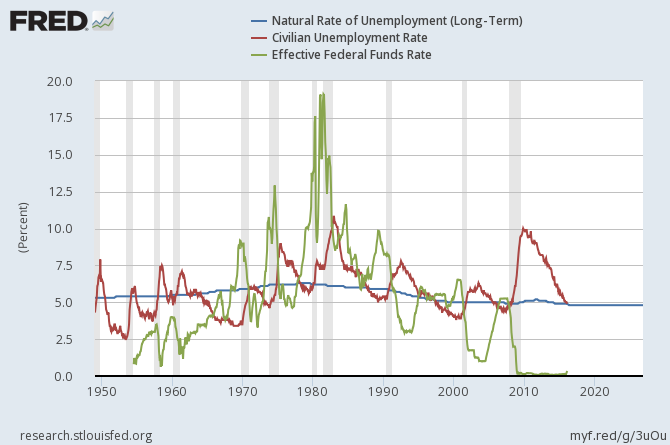
The Natural rate of unemployment (NRU) is also referred to as the zero inflation rate of unemployment, the full employment rate of unemployment or the Non-Accelerating Inflation Rate of Unemployment (NAIRU). In economics, there are three types of unemployment, friction, structural and cyclical and the NRU is equal to the sum of frictional and structural.
Frictional unemployment is oftentimes referred to as "wait and see" unemployment. This is when someone leaves their job of their own volition and starts looking for another job. I've always been a proponent of finding another job 1st before leaving my current job.
Structural unemployment is "unemployment by obsolescence". In other words your job skills (or lack thereof) are no longer needed (like an elevator operator). Also, the quantity of labor supplied exceeds the quantity of labor demanded, because there is a fundamental mismatch between the number of people who want to work and the number of jobs that are available.
Cyclical unemployment occurs as layoffs during a recession. Regardless of the cause of a recession, unemployment (a lagging indicator) always goes up during a recession and peaks after the end of the recession (below)
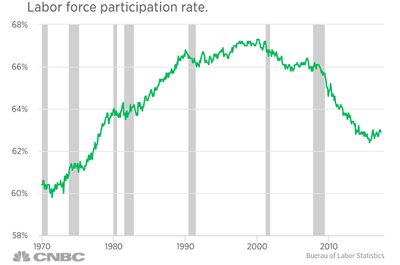
Labor force participation rate
To calculate this percentage simply divide the total civilian labor force into the total number in the civilian non-institutionalized population, multiply by 100 and express as a percentage.
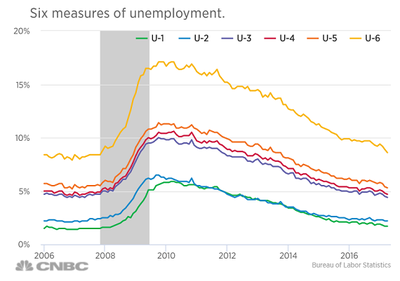
Six Measures of Unemployment (BLS)
U-1, persons unemployed 15 weeks or longer, as a percent of the civilian labor force;
U-2, job losers and persons who completed temporary jobs, as a percent of the civilian labor force;
U-3, total unemployed, as a percent of the civilian labor force (this is the definition used for the official unemployment rate);
U-4, total unemployed plus discouraged workers, as a percent of the civilian labor force plus discouraged workers;
U-5, total unemployed, plus discouraged workers, plus all other marginally attached workers, as a percent of the civilian labor force plus all marginally attached workers; and
U-6, total unemployed, plus all marginally attached workers, plus total employed part time for economic reasons, as a percent of the civilian labor force plus all marginally attached workers. (known as the Real Unemployment Rate)
Recession
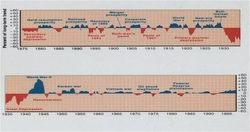
Most economic books define a recession as two consecutive quarters of negative GDP (Gross Domestic Product, the value of all goods and services produced in an economy in a calendar year). However, that is not the real world meaning. As defined by NBER, a recession is a significant decline in activity, spread across the economy, lasting more than a few months, visible in industrial production, employment, real income and wholesale-retail sales; NBER (National Bureau of Economic Research) is the non-profit agency located out of Cambridge which determines when we enter and exit a recession. The most recent recession (financial crisis) lasted from December 2007, to June of 2009, and while it was not the worst recession of the great depression (the double dip recession of the early 80's has that distinction), at 16 months, it was the longest. The period of longest expansion in the US (time in between recessions), was the decade of the 70's when the economy went 111 months (over 9 years) without a recession; and when we did have one in 2001, it was the mildest since the great depression. The average time in between recessions is 58 months. Since the last recession, it will be 72 months in June. This now begets the question, is there a recession on the horizon and what will be the cause. One of my students asked me a few years ago, if I could describe the cause of a recession in one word, what would it be? The easy answer would be a shock to the economy, but what would cause those shocks; in a word, GREED. The last recession was caused by a burst bubble in the housing market. The recession of 2001 was caused by a burst bubble in the dot com market, the recession of 1991 was caused by the S&L crisis of the late 80's (one governor of the FED estimated that as much as 50% of the banks that became insolvent was a result of corruption) and the recession of the early 80's and 73/74 were caused by OPEC oil embargo's/production cuts (with the intent of raising price) in one form or the other.
Inflation
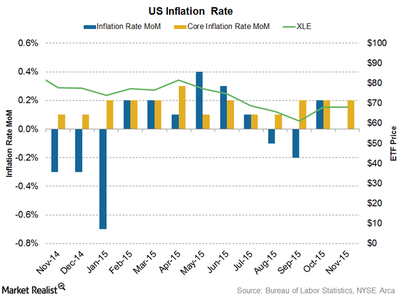
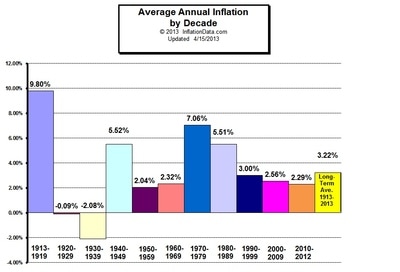
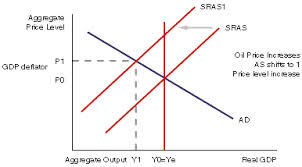
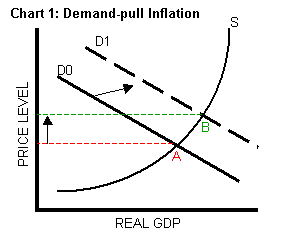
What causes inflation? There are essentially two types of inflation, Cost-Push, and Demand -Pull. The most common is Demand-Pull and we'll talk about that 1st. A quick definition of demand-pull inflation is too many dollars chasing too few goods, and is indicative of a recovering or healthy economy. Essentially what you have is an unemployment rate that is improving and therefore people are working and making money. If they're making money, they're spending it which will result in some shortages of goods and services, and when you have a shortage, prices generally increase (graph bottom right).
The other type of inflation is cost-push (bottom left graph) and is a function of business costs increasing (such as labor and energy), and these costs being passed on to the consumer in the form of higher prices. The most common type of cost push inflation is when energy prices increase. Even if businesses don't heat with oil (75% of all heating in the northeast is from oil), almost all businesses have to get their goods or services from point A to B. As you can probably deduce, any extra purchasing power that a person may garner thru an increase in the minimum wage is quickly eliminated as a result of businesses passing on their increased costs to the consumer in the form of higher prices.
Leading Economic Indicators
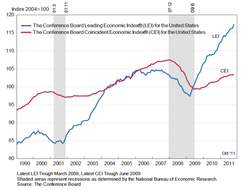
The leading economic indicators (LEI) are a gauge of 12 metrics that tend to forecast future economic activity (usually 3-6 months in the future. Some of the LEI's are manufacturing activity, Retail sales, Inventories, building permits and new business startups.
Marginal Propensity to Consume
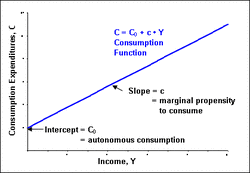
The MPC, Marginal Propensity to Consume, is the proportion of additional income that an individual spends. For example, if a household earns one extra dollar of disposable income, and the marginal propensity to consume is 0.95, then of that dollar, the household will spend 95 cents and save 5 cents. Obviously, the household cannot spend more than the extra dollar (without borrowing).
The MPC and MPS (Marginal Propensity to Save) always equal 1.
The chart at the left illustrates the consumption function that shows a change in Consumption given some change in disposable income. The function intercepts the y axis above the origin, this represents autonomous consumption which is basic sustenance level income; i.e., basic necessity consumption. This consumption level is known as dissaving since it requires either borrowing or money from savings (in theory). In real life, it is generally a transfer payment from the government.
Minimum Wage
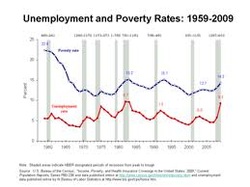
There is currently a debate in the state of NH on whether to increase the minimum wage to 8.25 from 7.25. The main argument is that it will help to alleviate poverty. That is clearly not the case. As you can see from the chart at the left, the poverty rate dropped dramatically in the 1960's. This was a function of great society legislation; specifically, increase in Social Security benefits in addition to the inception and implementation of Medicare and Medicaid. Since then, the poverty rate has fluctuated between 9-15% and is highly correlated with the unemployment rate. The vertical grey area's in the graph represent periods of recessions in the US. As can be expected, unemployment rises during recessions and peaks at the end (unemployment is said to be a lagging indicator). As you can also see from the chart, so too does the poverty rate. There is no indication whatsoever that the poverty rate is affected by increases in the minimum wage. Generally, this is quite the contrary. As can be evidenced from the below left chart, increases in minimum wage can contribute to unemployment and as we can infer from the above chart, as unemployment increases so to does poverty. If you look at NH, they have the lowest state poverty rate in the nation and it generally parallels the national unemployment rate. By raising the minimum wage, you increase business costs. As a result; businesses either pass these costs onto the consumer (in which case inflation nullifies any wage increase), substitute capital for labor, or simply go out of business. If you look at the chart below right, UAW (United Auto Workers) membership has decreased in the late 1970's from 1.5 million to 350,000 in 2009. The reason for this is simple. Detroit isn't making fewer cars, they are making more, but they have made their assembly lines more robotic and have substituted capital for labor, which became cheaper in the long run. This can also happen to those fast food workers who want a $15 minimum wage. There is currently a machine on the market that can make 300 burgers/hour. In other words, capital can be substituted for labor. Some please e-mail me and explain how someone is better off unemployed at $8.25/hour as opposed to being gainfully employed at $7.25/hour
You cannot legislate equality. If you want to decrease poverty, implement policies to insure that higher level education is available to all.
You cannot legislate equality. If you want to decrease poverty, implement policies to insure that higher level education is available to all.
Determinants of the Price of Gas
A primer of Supply & Demand
7-19-2013
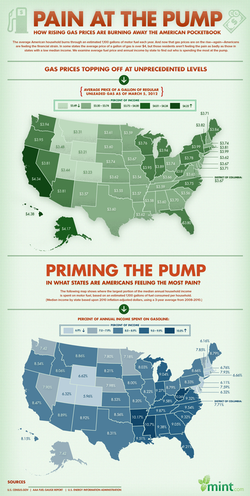
After increasing 10 cents the previous week, gas prices went up 12 cents/gallon this week according to the American Automobile Association. There are a number of reasons for this. The first couple are basic supply and demand. It is the summer driving season and people go on vacation. As a result there is more driving and a greater demand for gas. For all my econ students, this has the effect of shifting the demand curve to the right which increases equilibrium price and quantity demanded. The second is supply, lack thereof. In 1980, the United States had over 300 operating refineries in the United States, currently we have about 148 refineries of which 130 to 140 are operating at any given time, and a refinery has not been built since the 1970's. Once again for my econ students, this has the effect of shifting the supply curve to the left which increases equilibrium price, and reduces quantity supplied. In both instances, price is higher. Many of you are asking why. Look to the EPA that mandates extremely restrictive standards (others will say, not restrictive enough). As a result, many oil companies have found it less costly to simply shut down then comply with these rules. The refineries never operate at full capacity since some always shut down for maintenance periodically and have to "retool" for refining gas for a particular state. In other words, each state, has different additives that are blended into their road fuel; as a result, after making gas for one state, they have to change production for different additives for another state. For instance, there are 42 gallons in a barrel of oil; when gas is refined from oil for California, there are so many additives, that there are 47 gallons in the finished product. This, and a tax of 60 cents/gallon account for California having the highest gas prices in the continental US (don't forget a federal tax of 18.5 cents/gallon). What also affects supply is a lack of infrastructure. The Keystone pipeline would have rectified that in part, however, that's for next month's blog.
Expectations play a large role also. If the average consumer feels that prices will increase in the future, they will gas up now thereby increasing demand. For example, even tho I won't be using fuel oil to heat my house until October, I just spent $650 to fill my oil tank this week since I expect that price to be more expensive in October.
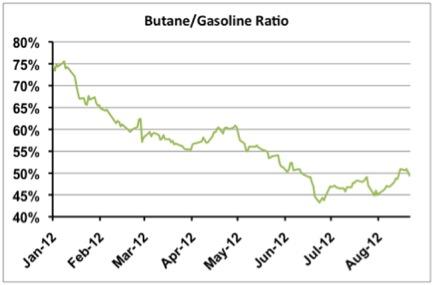
What else is can cause the price of gas to go up is when refineries switch for lower cost winter gas to more expensive summer gas. Summer gas has a lower Reid Vapor Pressure (RVP). The higher the RVP, the more easily it vaporizes and has more particulates released into the environment. The RVP is lower than 14.7 (atmospheric pressure) and the EPA mandates an RVP maximum of anywhere between 9.0 PSI and 7.8 PSI for summer-grade fuel, depending on region. Generally, the lower the RVP of a gas blend, the more it costs. For example, in winter you can blend butane, which is relatively plentiful and cheap, with gasoline; but butane, which has an RVP of 52 on its own, can't be used in summer since much of the gas would boil off. However, on the plus size, gas mileage is better with the summer blend. Environmental Protection Agency reports that summer-blend fuel delivers about 114,500 BTUs per gallon, as opposed to 112,500 BTUs for conventional blend — which translates into 1.8% better fuel efficiency (a match head is about a BTU).
Gas Tax
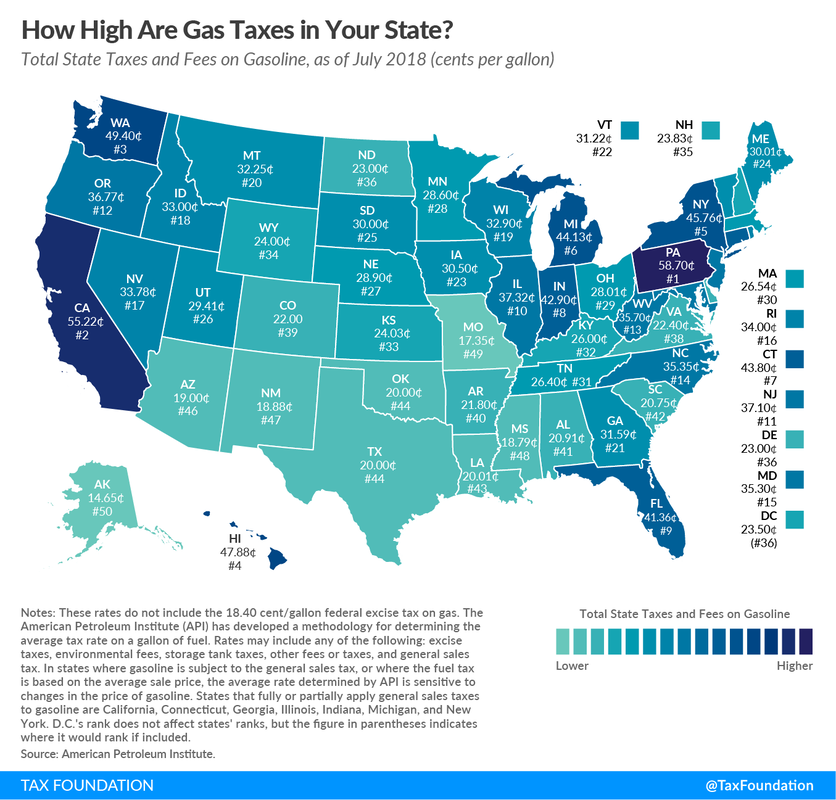
Most people don't realize what they are paying for taxes when they buy gas. They just notice the price at the pump and it's pretty good with the nationwide average on a gallon of regular gas currently at $2.38. In NH it's 2.33 and Ma $2.37. A good portion of that is tax. There are 2 taxes on a gallon of gas, the federal tax, 18.4 cents/gallon, and a state tax which range from a low of 16.75 cents (So Carolina) in the continental US (Alaska is 12.25) to a high of 58.2 cents in Pa. Let's look at NH, that has a state tax of 23.8 cents. Both the federal and state tax together mean that if you gas up in NH, you're paying 42.2 cents in taxes. Subtract that from the price of gas in NH of $2.33 means that you are paying $1.908 for the non-tax price of gas. The percentage tax on that is (.422/1.908) x 100 = 22.12% tax on each gallon of gas. That meets my definition of a high tax.
Increased Price = Decreased Demand
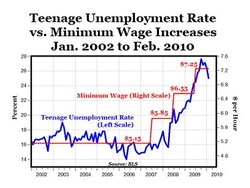
Seriously, in 4 different stages, Massachusetts wants to raise the state minimum wage to $11 by 2015. If Mass lawmakers aren't sure what to name this bill my suggestion would be the NH Economic Recovery Program since you will see a mass exodus (pun intended) of small businesses leaving the Bay State for NH, if they don't like that they can call it the Continuing Teenage Unemployment Act. This will have an extremely adverse affect on small businesses since they are the ones who pay minimum wage. I recently asked my wife who is an HR Director for a Xerox subsidiary in the Northeast how many minimum wage workers she has on payrolls over 500. Her reply, "None, we can't get anyone for minimum wage". So once again I ask, are lawmakers doing what's good for the economy or what will get them re-elected. Can someone from Mass explain to me how someone is better off unemployed at $11/hour as opposed to being employed at $8/hour (and yes, I am paraphrasing Milton Friedman). For more info, see my March blog.
