I’ve been asked a number of times on facebook as to how long the economy will take to recover. The short answer is, I not sure, and it depends. What I can compute with some certainty is what the cost has been so far of the quarantine, but there are also intangibles.
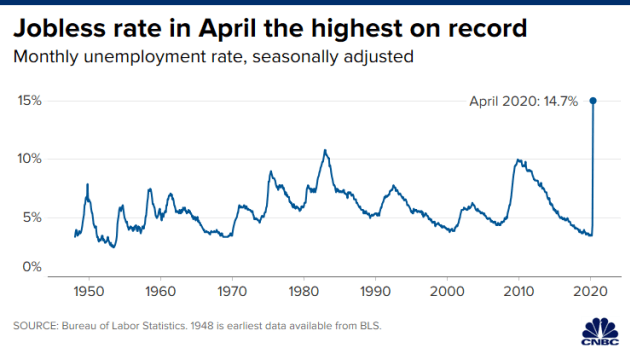
To figure out the cost we’ll initially look at quarter 1 GDP which declined by 4.8% on an annual basis. Given GDP in 2019 was $21.429 trillion, that comes out to $1,028.592,000; that’s a trillion with a T, but it doesn’t stop there. The unemployment rate skyrocketed to 14.7%, the highest since the height of the great depression in 1933 when it was 23%, and the economy lost 20.5 million jobs. Given that mean pay was $50,000 in 2018 (SSA.gov) and allow for 2 years of 3% raises, that comes to $53,045/12 months is $4,420/month, times 2 months unemployed is $8,840, times 20.50 million comes out to a loss in income of $181,220,000,000; that’s $181.22 billion with a B. There is a possibility of double counting since many are getting the $600/week stipend from the government which would be part of the CARE act.
To figure out the cost we’ll initially look at quarter 1 GDP which declined by 4.8% on an annual basis. Given GDP in 2019 was $21.429 trillion, that comes out to $1,028.592,000; that’s a trillion with a T, but it doesn’t stop there. The unemployment rate skyrocketed to 14.7%, the highest since the height of the great depression in 1933 when it was 23%, and the economy lost 20.5 million jobs. Given that mean pay was $50,000 in 2018 (SSA.gov) and allow for 2 years of 3% raises, that comes to $53,045/12 months is $4,420/month, times 2 months unemployed is $8,840, times 20.50 million comes out to a loss in income of $181,220,000,000; that’s $181.22 billion with a B. There is a possibility of double counting since many are getting the $600/week stipend from the government which would be part of the CARE act.


Next is the US government CARE act which gives an extra $600/week in unemployment benefits, which incidentally, is an incentive for people not to go back to work since they are now making more money unemployed than employed. At the very least, Congress is consistent in their stupidity. During the great recession, they increased unemployment benefits to 99 weeks. As a result, the long term unemployment rate (people unemployed for more than 26 weeks) reached its highest rate ever of 47% of all those unemployed; i.e., why work when you can get money for free. So far, the Care Act 1.0 and 2.0 have cost $2 trillion and they are considering a 3rd money giveaway. Just for the record, the last time the US was without debt was in 1836. Between then and 2008, the debt, in nominal figures, increased to $10 trillion. During the Obama years, it doubled to $20 trillion and it is currently $25 trillion and is expected to be over $26-$27 trillion by the years end. Just since March 1, the national debt has grown by $1.5 trillion to $24.9 trillion, a 6.4% increase. The budget deficit through March, or the first six months of the fiscal year, totaled $744 billion, on pace to easily eclipse the biggest shortfall in U.S. To me this is unexcusable given the best economy (what was) in 50 years; but I digress.
One analyst on CNBC stated that the US would lose 100,000 businesses would fail as a result of the quarantine and mandatory shutdown. This can be anything from a 1 person cleaning to business to a major airline of cruise line.. Norwegian Cruise Line Holdings recently announced that there is some chance that it may not continue as a going concern. They are the 3rd largest cruise line world wide. To be conservative, the average revenue of a small business is $7 million (paychex.com) times 100,000 businesses is $700 billion.
One analyst on CNBC stated that the US would lose 100,000 businesses would fail as a result of the quarantine and mandatory shutdown. This can be anything from a 1 person cleaning to business to a major airline of cruise line.. Norwegian Cruise Line Holdings recently announced that there is some chance that it may not continue as a going concern. They are the 3rd largest cruise line world wide. To be conservative, the average revenue of a small business is $7 million (paychex.com) times 100,000 businesses is $700 billion.

There are other costs, but given only the above, we’re looking at $3.909 trillion. However, we’re not even looking at the untangibles such as: alcoholism, in NH alone alcohol sales have increased by 15%; suicides, there is a positive relationship between unemployment and suicides, during the great depression suicides more than doubled; obeisity health clubs are closed, divorces, increases in ambulance calls from poisoning (20% nationwide according to the Manchester Union Leader) and the list continues.
What one must ask is at what point does the cure eclipse the disease.
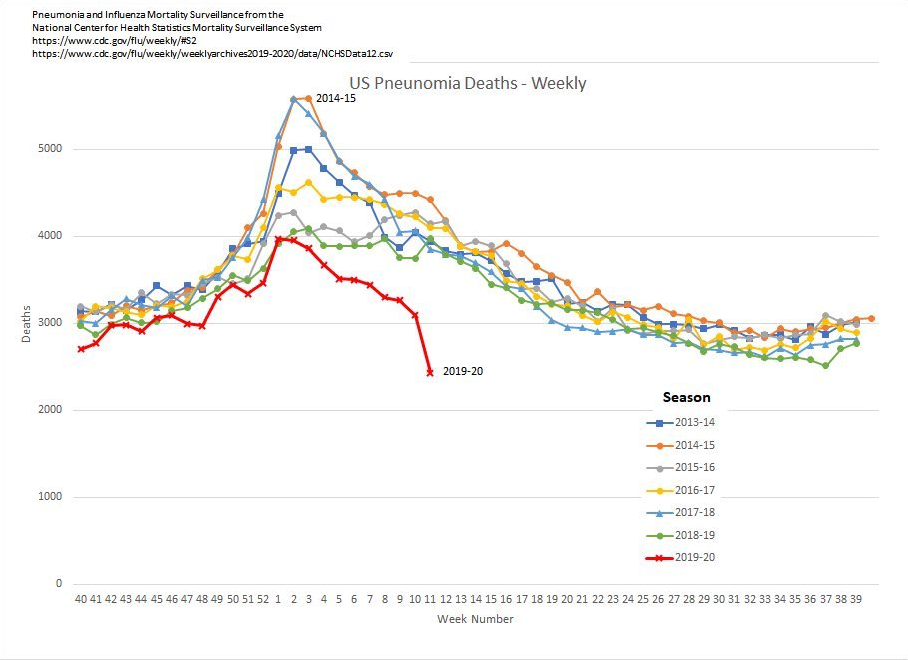
Speaking of the disease, at the time of this writing, May 8, there have been 78,615 deaths in the US that have been sttributed to covid 19, the key word being attributed. On April 14, the CDC changed the guidelines and gave directions that any death that has the symptons of covid 19, is to be counted as such even tho a covid 19 test wasn’t performed, and this was done retroactively (it should be noted that Medicare pays a hospital more for a covid 19 death than a non-covid 19 death). As a result, deaths spiked. Coincidentally (chart) deaths from pneomonia this year dropped dramatically compared to previous years. Granted, the quarantine can account for some of that decrease, but not over 1000/week. Looking at the attached chart that shows deaths by day and a polynomial regression curve, it is approximating a bell shaped curve (chart). Given it’s asymmetrical, we’re looking at about 96,000-110,000 deaths in the US being attributed to covid 19. The assumption is that the number of deaths continues its trend which may be in doubt given that some states are opening their economies. My orginal estimate of deaths was 80,000. If you subtract 1000 deaths per week from the end of week 8, the 1st week of a 1000 death drop in pneumonia to week 26, the end of June, that’s 16,000 subtracted from the interval now yields 80,000-96,000 covid 19 deaths.
What one must ask is at what point does the cure eclipse the disease.
Speaking of the disease, at the time of this writing, May 8, there have been 78,615 deaths in the US that have been sttributed to covid 19, the key word being attributed. On April 14, the CDC changed the guidelines and gave directions that any death that has the symptons of covid 19, is to be counted as such even tho a covid 19 test wasn’t performed, and this was done retroactively (it should be noted that Medicare pays a hospital more for a covid 19 death than a non-covid 19 death). As a result, deaths spiked. Coincidentally (chart) deaths from pneomonia this year dropped dramatically compared to previous years. Granted, the quarantine can account for some of that decrease, but not over 1000/week. Looking at the attached chart that shows deaths by day and a polynomial regression curve, it is approximating a bell shaped curve (chart). Given it’s asymmetrical, we’re looking at about 96,000-110,000 deaths in the US being attributed to covid 19. The assumption is that the number of deaths continues its trend which may be in doubt given that some states are opening their economies. My orginal estimate of deaths was 80,000. If you subtract 1000 deaths per week from the end of week 8, the 1st week of a 1000 death drop in pneumonia to week 26, the end of June, that’s 16,000 subtracted from the interval now yields 80,000-96,000 covid 19 deaths.
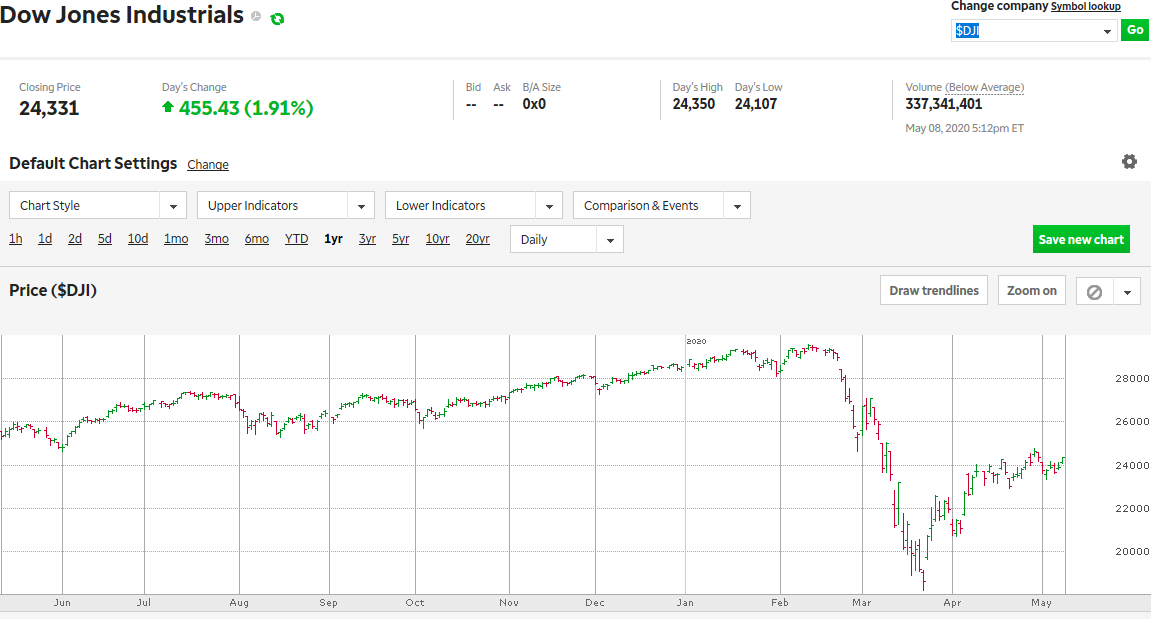
Now for the $64 question, when will the economy recover? Analysts on CNBC have said anything from 3 months to 3 years. The stock market is a leading economic indicator. The Nasdaq is at the same level it was at the beginning of the year and the S&P 500 and Dow Jones is 30% above its lows. This is key since it deals with the wealth effect and the amount of money consumers pay. Many individuals are suffering financially, but many are also not because of the governments benefits to unemployment. In addition, people on fixed incomes are no worse off and they may be better off since they are getting the $1200 stimulus checks (tax free). As a result, I’ll predict positive GDP by the 3rd quarter and stocks will be back to their per-covid 19 highs by this time next year assuming no exogenous shocks to the economy.
 RSS Feed
