One of the interesting facets of teaching at Bentley was that 11% of the student population were foreign nationals, and a number of these came from countries that tended to be very socialistic. I would ask them how to describe the socioeconomic status of a family that owned a house, a car or truck or 2, cable or satellite TV, a computer, video game system, and rarely to never went hungry. To a person , they all said middle to upper middle class. However, if you look at the statistics below from the 2009 US government census (the last year we have these stat’s), they are in Poverty in the US.
First: US Poverty Guidelines:
• The 2015 Poverty Guidelines for the
48 Contiguous States
• 2007 Median Household Income $50, 233 2010 $49,777
– Persons in family Poverty guideline
• 1 $11,670
• 2 15,730
• 3 19,790
• 4 23,850
• 5 27,910
• 6 31,970
• 7 36,030
• 8 40,090
First: US Poverty Guidelines:
• The 2015 Poverty Guidelines for the
48 Contiguous States
• 2007 Median Household Income $50, 233 2010 $49,777
– Persons in family Poverty guideline
• 1 $11,670
• 2 15,730
• 3 19,790
• 4 23,850
• 5 27,910
• 6 31,970
• 7 36,030
• 8 40,090
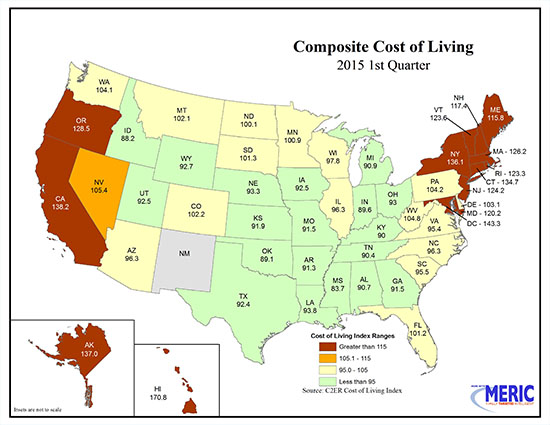
However, like minimum wage, this one size fits all Federal Government mentality doesn't work. As you can see from the above chart, the cost of living differs greatly throughout the US., and where you may be in poverty living in New York, you may not be in poverty living along the Mexican border, on a reservation in Arizona or in the Mountains of Appalachia. Consider the following:
According to the 2009 Census, the following statistics are from those defined to be in poverty in the US (compiled by the Heritage Foundation):
• 42 percent of poor households actually owning their own homes
• 80 percent of poor households have air conditioning
• 75% have a car or truck, and 31 percent have two or more cars or trucks
• 65% have cable or satellite television
• 66% have at least one DVD player and 70 percent have a VCR
• 50% have a personal computer, and one in seven have two or more computers
• More than half of poor families with children have a video game system, such as an Xbox or PlayStation
• 43 % have Internet access
• 33% have a wide-screen plasma or LCD television
• 25% have a digital video recorder system, such as a TiVo
• 96 percent of poor parents stated that their children were never hungry at any time during the year because they could not afford food
• 83 percent of poor families reported having enough food to eat, and over the course of a year, only 4 percent of poor persons become temporarily homeless
Clearly, Poverty in the United States differs greatly from poverty in the rest of the world. But there's more. Are people in poverty starving. If you look at the attached chart, you will see that area's of poverty correlate to areas of low cost of living, and if you look at the chart below:
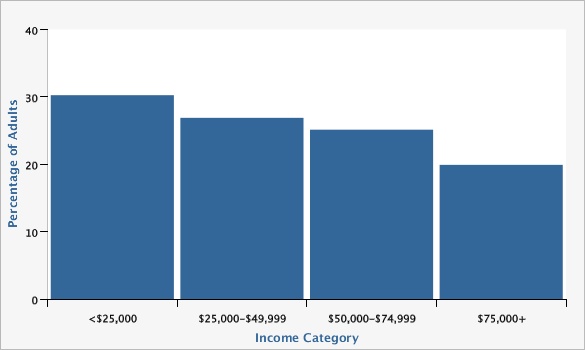 Obesity by Income Quintile
 you can see that people in the lowest income quintile are clearly not starving. Their nutrition is clearly not the best. There are a number of reasons including cheap, junk food has more calories then high protein expensive food. But they are certainly not as bad off as Bernie Sanders or Hillary Clinton would have you think.
 RSS Feed
