 SS Taxable Income (click to enlarge)
 Old Age Survivors and Disability Insurance, known to everyone as Social Security, was signed into law by FDR in 1935 as part of his new deal legislation. It is currently the largest program in the world and at 22% of the Federal Budget, represents the greatest expenditure of that budget. It keeps 46% of people over 65 out of poverty and I think it is a great program. However, its administration, like most programs run by the Federal Government has much to be desired; but first, some history.
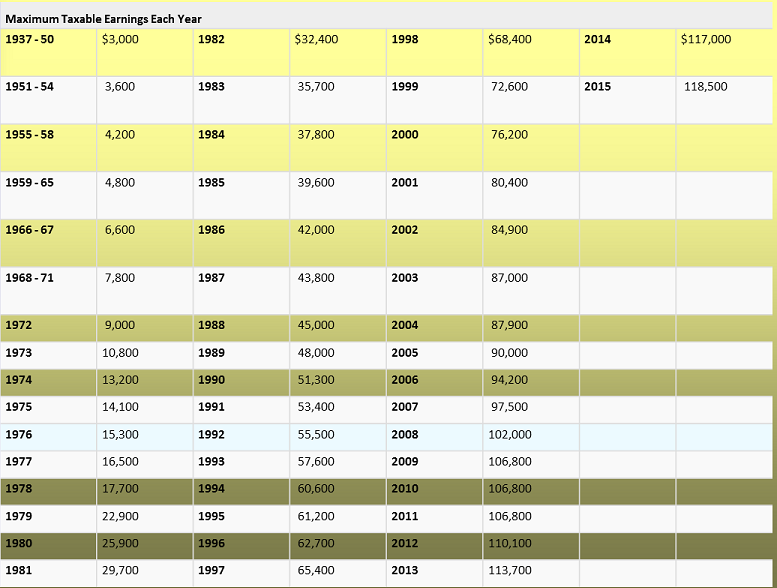
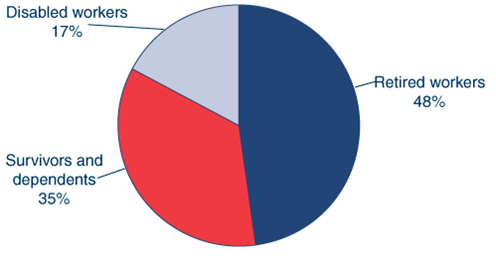
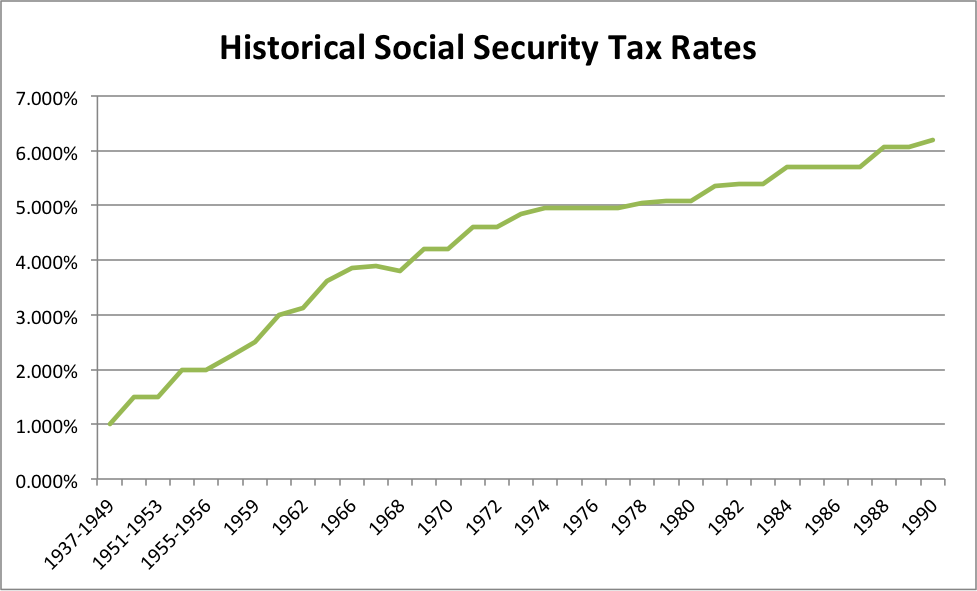
After it was signed into law it was implemented in 1937 and only the 1st $3000 of income was taxed and at the rate was 1%. In 2015, the maximum amount of taxable earnings is $118,500, and it will be taxed at 6.2%(this is matched by your employer). This is a function of the increased life span of Americans in addition to the larger amount of people on Social Security. When social security was passed, life expectancy was 65 which meant that half of the people contributing to social security would not live to collect it (life expectancy follow a bell shaped curve distribution). However, even though life expectancy has increased by 14 years in the US, the retirement age has only been increased to 66. Social Security is not only for retired workers, but survivors/dependents and people who are disabled.
After it was signed into law it was implemented in 1937 and only the 1st $3000 of income was taxed and at the rate was 1%. In 2015, the maximum amount of taxable earnings is $118,500, and it will be taxed at 6.2%(this is matched by your employer). This is a function of the increased life span of Americans in addition to the larger amount of people on Social Security. When social security was passed, life expectancy was 65 which meant that half of the people contributing to social security would not live to collect it (life expectancy follow a bell shaped curve distribution). However, even though life expectancy has increased by 14 years in the US, the retirement age has only been increased to 66. Social Security is not only for retired workers, but survivors/dependents and people who are disabled.

As you can see from the charts below, with the onset of great society legislation, the increases began to increase at an increasing rate. Combine this with the fact that there are currently 3 people working for every person who is collecting social security as opposed to over 40 worker for every one on social security.
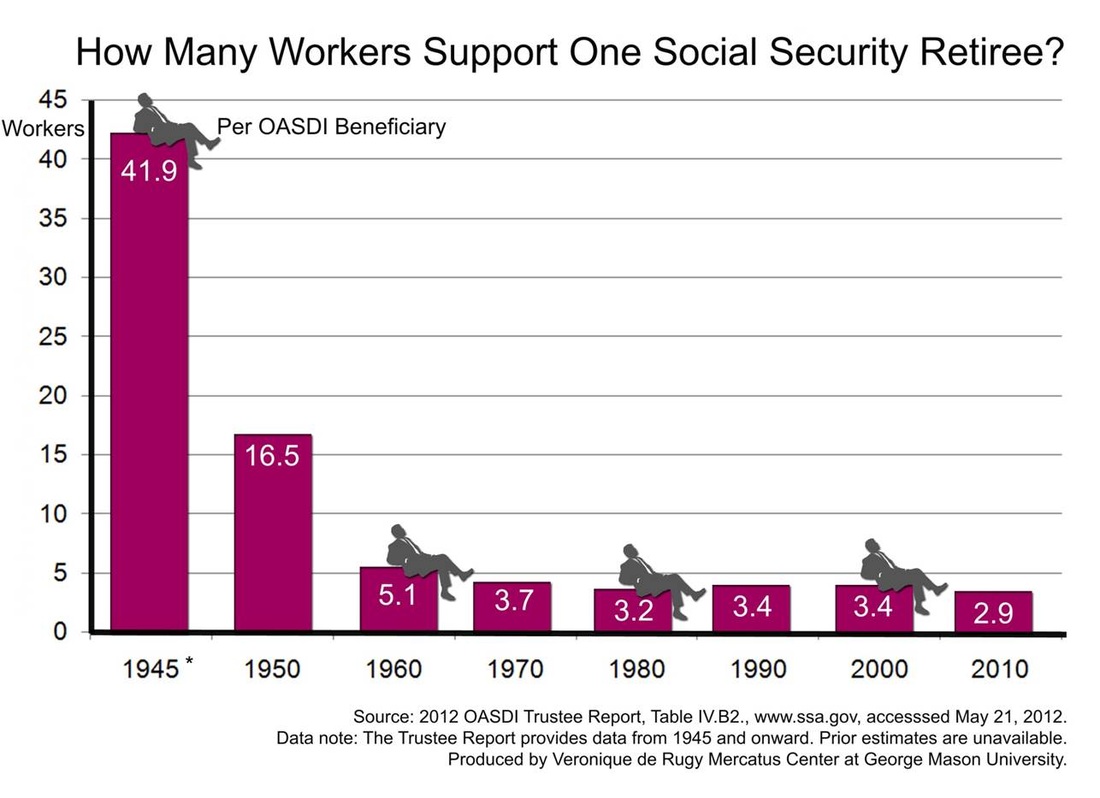
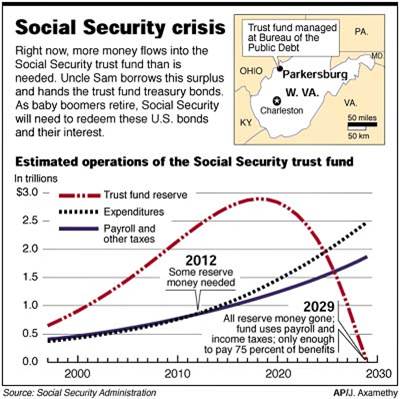
As a result, the amount of expenditures are now exceeding revenues and the amount of money in the trust fund is decreasing. Estimates vary, but at current levels of expenditure and revenue receipt, the CBO (Congressional Budget Office) estimates that the Social Security trust fund will be bankrupt somewhere between 2030 to 2050. My students ask me all the time if SS will be around for them. There is no doubt in my mind that it will; Congress will continue to pass higher tax rates and it will continue to raise the tax limit; or it can do something intelligent.

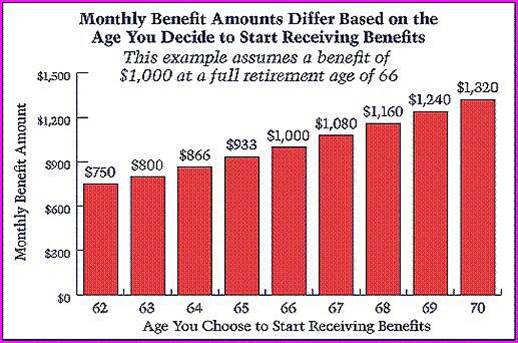
Believe it or not, they already have. Congress passed a law that allows people to collect Social Security at an earlier age, albeit at a reduced rate (chart above). Doing the math, if you take early social security at age 62 and live past 74 (life expectancy is 78.8), then you are loosing money and the government is saving as opposed to you collecting full retirement. There is also another catch to early SS benefits. If you make more than $15,000, then for every $2 above 15k, $1 gets taken off your benefits until you reach full retirement age. As you can see by the graph to the left, close to 45% of recipients are taking this early benefit. What else can they do and you may be asking yourself, where does the Social Security Administration keep the money in the trust fund and is making any money? To little surprise, they invest the surplus money in virtually risk free government bonds that have an interest rate that barely keeps ahead of inflation. The current yield on the 10 year government bond is 2.3% and year over year inflation is 1.7% at he time of this writing.
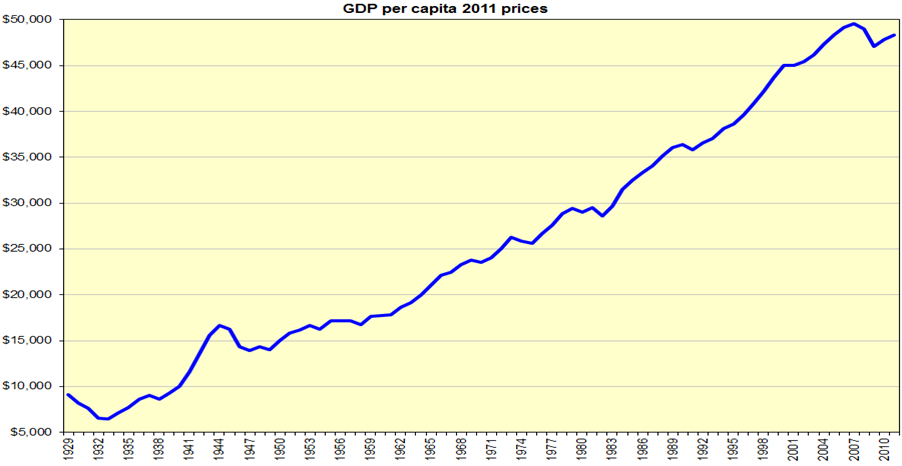
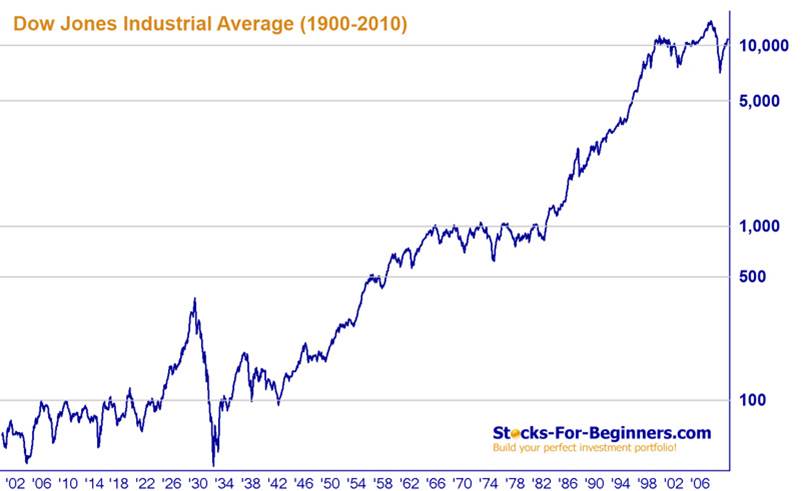
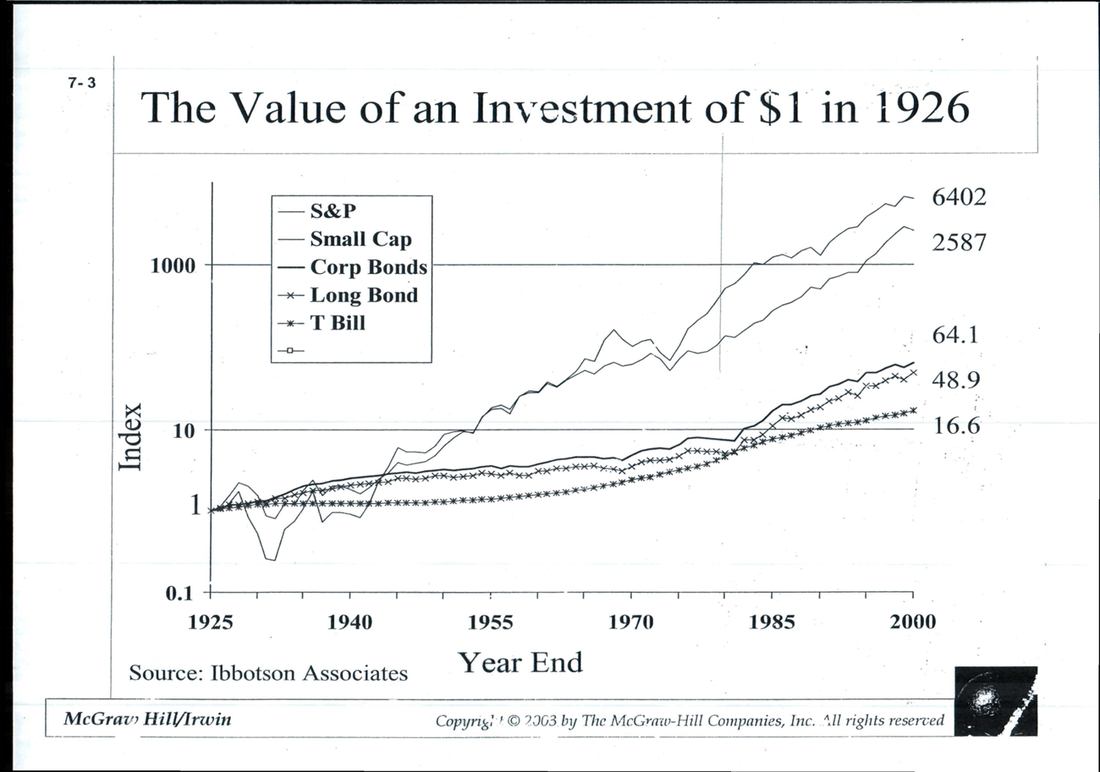
Ask any freshman business student what is the number one rule of financial portfolio management and he/she will tell you diversification, something the Social Security Administration is not doing. At this point, some of you are probably thinking, invest my SS money in the stock market, absolutely not! Relax and let's look at the figures and the numbers. Simply put, the stock market mirrors the American economy and over time, the American economy has gone nowhere but up, albeit with some bumps in the road but it remains upward trending (charts below).
Ask any freshman business student what is the number one rule of financial portfolio management and he/she will tell you diversification, something the Social Security Administration is not doing. At this point, some of you are probably thinking, invest my SS money in the stock market, absolutely not! Relax and let's look at the figures and the numbers. Simply put, the stock market mirrors the American economy and over time, the American economy has gone nowhere but up, albeit with some bumps in the road but it remains upward trending (charts below).
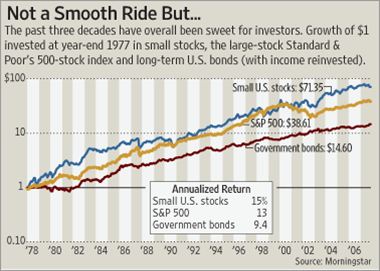
Now let's look at some specifics, the chart (below) on the left shows you the value of a dollar in 2000 given various investments in 1926. If SS was around in 1926, the $1 it put in government bonds would be worth $16.60, barely staying ahead of inflation. Yet if you invested it in the S&P 500 or the Wilshire small cap stock fund, it would be worth $2587 and $6402 respectively. The chart on the right (which isn't to scale), shows the same information but since 1978. I am by no means implying that all of the money in the trust fund should be invested in stocks,but a certain percentage such as 30 to 50%. If it had done this, then I strongly believe the SS Administration would not be in the precarious financial situation that it is in now.
 RSS Feed
