
The president and followers want to increase the minimum wage to $9/hour from the current $7.15; part of his argument is that it will help lower the poverty level. Really, why then has there been no significant change in the poverty level since the 1960's and what is poverty in the United States and is it different from the rest of the world.
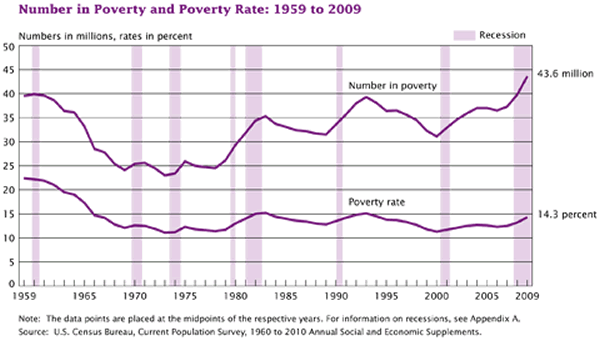
If you look at the accompanying charts, you will see that poverty came down drastically in the sixties from over 20% to about 12%. The reason for this was great society legislation in the form of medicare, medicaid and increased social security benefits. However, for the past 50 years, it has fluctuated between 9% to 15% depending on the economy. Getting more specific, the poverty rate correlates very closely with the unemployment rate. The unemployment rate is a lagging indicator and peaks after recessions, as does the poverty rate. Since that time, the minimum wage has been increased 16 times with no change in the range of the poverty level. This begets the question that a student asked a couple of years ago, "Why hasn't the poverty level in the United States changed in the past 50 year?" An excellent question; but before we go any further, let's take a look at poverty in the United States.
Poverty levels are determined by the Department of Health and Human services and are as follows:
–Persons in family Poverty guideline
•1 $11,490
• 2 15,510
• 3 19,530
• 4 23,550
• 5 27,570
• 6 31,590
• 7 35,610
• 8 39,630
The obvious question is how can a family of four live on $23,550 per year. Obviously not in luxury and obviously the cost of living differs from one geographical location to another. However, let's not forget the 58 million people who receive government assistance in the form of medicaid payments from both the various states and federal government. Many of you are probably asking yourself what people in poverty are going without? According to the Heritage foundation, not that much. The following statistics were compiled by the Heritage Foundation based on the 2009 census:
•42 percent of poor households actually owning their own homes
•80 percent of poor households have air conditioning
•75% have a car or truck, and 31 percent have two or more cars or trucks
•65% have cable or satellite television
•66% have at least one DVD player and 70 percent have a VCR
•50% have a personal computer, and one in seven have two or more computers
•More than half of poor families with children have a video game system, such as an Xbox or PlayStation
•43 % have Internet access
•33% have a wide-screen plasma or LCD television
•25% have a digital video recorder system, such as a TiVo
•96 percent of poor parents stated that their children were never hungry at any time during the year because they could not afford food
•83 percent of poor families reported having enough food to eat, and over the course of a year, only 4 percent of poor persons become temporarily homeless
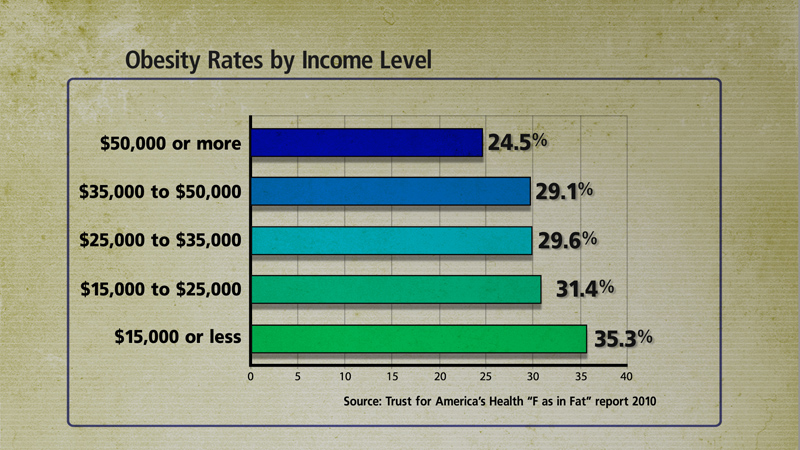
Also, as you can see from the accompanying chart and from the Heritage Foundation statistics, not many in the United States go without food.Granted, most people in the lower income level may not know that much about nutrition and high caloric food is cheaper to purchase than more healthy food with fewer calories, but few go without given those numbers.
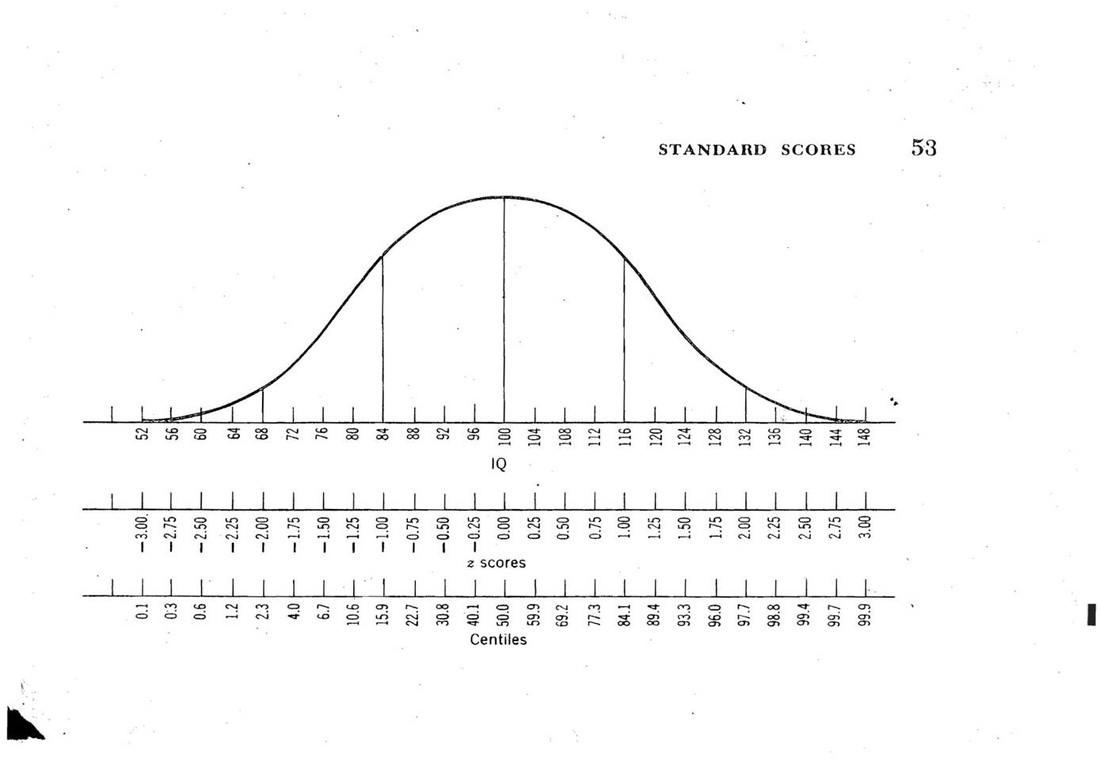
Back to the original question. Why has the poverty level not changed and fluctuated within a fixed range for the past 50 years. If you look at the chart at the left, you will see a normal bell shaped curve that shows the distribution of IQ's in the United States. The average IQ is 100 with a standard deviation of 16. If you remember your HS or College statistics, you will realize that 50% of the population has an IQ above 100 and 68% of the population has an IQ between 84-116 (plus and minus 1 standard deviation). Further analysis will show that about 10% of the population has an IQ under 80. It doesn't require a great leap of faith to realize that those with a lower IQ have a diminished chance of earning income. I'm not saying that everyone with a low IQ is in poverty (anyone can dig a ditch or empty a bedpan) and many have care givers; but I believe a good percentage of this segment of the population is in poverty. That combined with people who are lacking in drive and motivation (or just want to use the system to their advantage) from the right hand side of the curve comprise what I refer to as a Natural Rate of Poverty, not unlike the Natural Rate of Unemployment. I believe that The Natural Rate of Poverty is in the vicinity of 9-11% and the fluctuation is a result of the business cycle and accompanying unemployment rates, i.e., as the unemployment rate decreases so does poverty and vice versa; i.e., If you want to decrease poverty, implement policies that motivate people to work and are conducive to businesses hiring additional employees.
Addendum: In a recent class, after I presented the Heritage's foundation statistics on poverty, I asked two of my students from eastern Europe what this would equate to in their countries. Their response was that those ownership statistics would be equivalent to someone who would be considered middle to upper middle class.
Addendum: In a recent class, after I presented the Heritage's foundation statistics on poverty, I asked two of my students from eastern Europe what this would equate to in their countries. Their response was that those ownership statistics would be equivalent to someone who would be considered middle to upper middle class.
 RSS Feed
