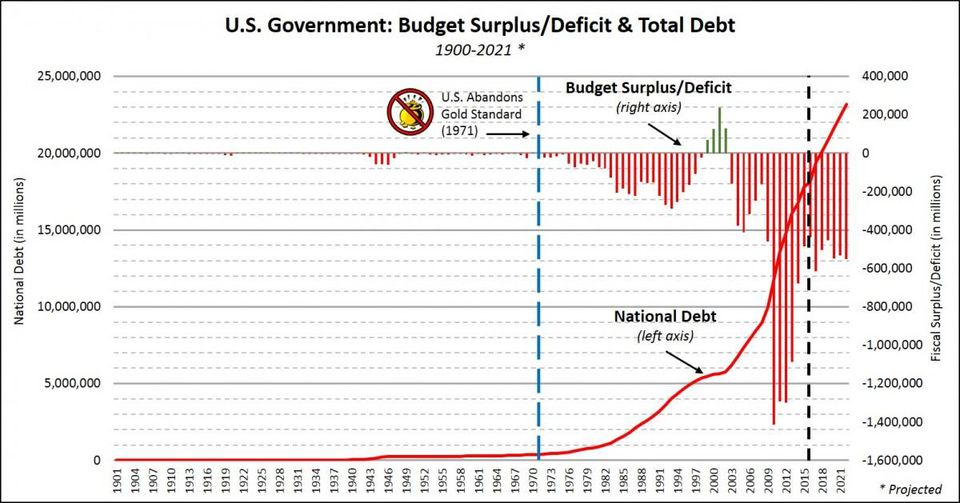
JohnTommasi.com: The Economics of Unintended Consequences & Common Sense
  • Home
  • Danger Zone
  • About/Contact
  • Blog
  • Stock Pick of the week
  • FED Speak
  • Courses Abroad

Increasing Healthcare Costs

11/11/2018

0 Comments

 
Picture
​     The Kaiser foundation recently released its annual report on the cost of family health coverage and it isn’t pretty.  Premiums, co-payments and deductible have all increased.  A co-payment is what you pay every time you incur a healthcare cost.  The most common is when you pay your primary care physician when you go to see him/her and it is usually in the range of $10-$25; close to 70% of all plans have a co-payment.  A deductible is what you have to pay out of pocket before your insurance starts to pay. The average deductible for a single person is almost $1600 and for a family plan about $4000; 85% of all covered employees have some form of deductible.  Cop-payments and deductibles generally don’t apply to any type of annual wellness testing such as a yearly physical or mammography.  What’s disconcerting is that deductibles have increased 8 times as fast as wages in the past 10 years.  In the past 5 years, that represents a 53% increase.
  The average cost of health insurance for a family plan is up to $19,600, with the average employee contribution at 30% at $5,800.  In the past 10 years, inflation has been 51%, employee wage growth 68% and total premiums 239%.
   While the vast majority of firms are small, most workers work for large firms that offer coverage. In 2018, 90% of workers are employed by a firm that offers health benefits to at least some of its workers.  Even in firms that offer health benefits, some workers are not eligible to enroll (e.g., waiting periods or part-time or temporary work status) and others who are eligible choose not to enroll (e.g., they feel the coverage is too expensive or they are covered through another source). In firms that offer coverage, 79% of workers are eligible for the health benefits offered, and of those eligible, 76% take up the firm’s offer, resulting in 60% of workers in offering firms enrolling in coverage through their employer. All of these percentages are similar to 2017.  Among all firms that offer health benefits, 13% provide additional compensation or benefits to employees if they enroll in a spouse’s plan, and 16% provide additional compensation or benefits to employees if they do not participate in the firm’s health benefits (Kaiser Foundation).
     Health care costs, since the 60’s, have been increasing at paces at least 4 times that of inflation.  The spike in the 60’s was a result of the implementation of both Medicare and Medicaid.  That increased with the implementation of the Affordable Care Act.  

0 Comments

Is a recession coming?

9/27/2018

0 Comments

 
​   If you look at any principles of macroeconomics book, it will define a recession as two consecutive quarters of negative GDP.  However that is not entirely true.  The organization that tells us when a recession starts and ends is NBER, the national Bureau of Economic Research.  This is an independent think tank that was formed in the early 1920’s in Cambridge, MA.  From there website: NBER is the nation's leading nonprofit economic research organization. Twenty-seven Nobel Prize winners in Economics and thirteen past chairs of the President's Council of Economic Advisers have held NBER affiliations.   At one point, former FED chairman Ben Bernanke was the Director of NBER. 
Picture
​   NBER defines a recession as  A significant decline in activity, spread across the economy, lasting more than a few months, visible in industrial production, employment, real income and wholesale-retail sales; NBER.  The downturn must be Prolonged, Protracted and Pervasive.  As a result, NBER usually doesn’t know that we are in a recession until 6-9 months after it started, and doesn’t tell us when it ends until 6-9 months.  For example, the most recent recession began in December of 2007, but it wasn’t stated by NBER until fall of 2008.  Looking at the accompanying charts, we can see recessions and expansions in the economy.  Most notable, in the later half of the 20th century, these fluctuations have become less variable, and the period of expansion (growth without a recession) longer.   Why is this?  The answer is relatively simple, we have gotten better at economics.  To date, the longest expansion in the US was in the 1990’s and it lasted 111 months.  The most recent recession was not the worst since the great depression (that would be the double dip recession of the early 1980’s), but it was the longest at 18 months and ended in June of 2009.  We are currently approaching a new record for a period of expansion.  In addition, we are in the longest bull market in history (since March of 2009).

   ​   This now begets the question, when is the next recession.  The short answer is that I don’t see one in the short term (3-6 months) unless there is some major shock to the economy such as a 9/11 scenario.  What’s interesting is that every republican president since Teddy Roosevelt has experienced a recession during their 1st term.  The reasons for this are varied, but it is not because of Republican policies.  The stock market is generally a leading economic indicator, and since Trump was elected, it has gone from 18,000 to nearly 27,000, a nearly unprecedented increase (chart).  Unless there is a total breakdown in trade talks, (see last month’s blog), I see the expansion continuing.  In addition, every recession has been accompanied by an inverted yield curve, and it is not close (chart).  
​   A student of mine once asked me, “ In one word, what is the best way to describe the cause of a recession?”.  I thought about for about a day and came back with the answer of Greed, and contrary to Gordon Gekko from the movie Wall Street, greed is not good.  If you look at the double dip recession of the 1980’s, it was high commodity prices coupled with high interest rates and the bubble burst.  The recession of the late 80’s was the savings and loan crisis and that bubble burst, the 1991 recession was the housing market bubble bursting, the 2001 recession was an inflated stock market and the dot com bubble burst and finally the most recent recession was a HIGHLY inflated housing market in which the bubble didn’t burst, it exploded, and if it wasn’t for the actions of Ben Bernanke, we could have quite possibly seen a 2nd depression.   As of now, I see no storm clouds on the horizon and no bubbles.  I expect the economy and stock market to keep chugging, especially, if trade agreements are reached by the November elections.
0 Comments

Trade & Tariffs for Dummies

9/2/2018

0 Comments

 
Picture
​Abraham Lincoln once said, “I don’t know much about trade, but what I do know is that if an American buys a coat from an Englishman, the American has the coat and the Englishman has the money, but if an American buys a coat from an American, the American has the coat and another American has the money”.  At first, it sounds logical, but he failed to take into account 2 important concepts, opportunity cost and comparative advantage.  
    Opportunity cost is the value of the best alternative use of a resource.  For instance, if you go to college, your opportunity cost is the money you forego from working full time.  If you’re a farmer and you grow corn, the opportunity cost is what you’re not growing, such as potatoes. 
   Comparative advantage occurs when a country is able to produce a good at the lowest opportunity cost.  For instance, why don’t we grow bananas in New England?  Well, if we did, we would get very small bananas and if we’re growing bananas, we can’t grow a crop that is cheaper to produce and would garner us more revenue, such as corn, apples or potatoes.  Hence, we trade our apples for Jamaican bananas.  Hence, Ben Franklin’s quote comes to mind, “no nation was ever ruined by trade”.  

Picture
​   Another quote that comes to mind is “if you don’t learn from history, you are doomed to repeat it.”  During the great depression GDP was plummeting.  In order to spur the economy, Congress, passed amongst the highest tariffs in history, specifically the Smoot-Hawley tariff.  The logic being Americans will buy from other Americans instead of international goods.   What Congress didn’t realize was the unintended consequence.  At that time, the balance of trade in the US was positive, in other words, we exported more goods than we imported.  As a result of the tariffs the US imposed, other countries reciprocated and world trade plunged by 2/3 ‘s making a bad situation for the economy worse.  It took 4 years, but the tariffs were eventually removed.

Picture
​     Fast forward to now.  President Trump has imposed the largest tariffs since the depression and other countries have reciprocated, and yes, we are in a trade war with China.  Plan on seeing world trade falling as well as GDP (Gross Domestic Product, how we measure growth).  I think the tariffs are a terribly bad idea, HOWEVER, we have just re-negotiated a trade deal with Mexico that puts us in a better position than we were with NAFTA (North Atlantic Free Trade Agreement), and that most likely will occur with Canada (our largest trading partner) also.  In addition, it will be a matter of time before we re-negotiate deals with China and the European Union, AND if we end up in a better trading position, it would appear that Trump would be crazy like a fox.

Picture
 A note on the European Union:
     The EU was formed in 1958 and was based on a famous US document; the US Constitution.  There is an article in the Constitution that states that one state can't tax the goods and services of another state.  In 1957 (treaty of Rome), initial members of the EU realized that free trade is good and adopted that verbiage.  There are currently 28 members in the EU, up from its initial membership of 15 and in addition to free trade, there is also free passage from one country to the next. 
     The EU should not be confused with the Eurozone.  There are 19 countries in the Eurozone (which are also EU members) that have adopted the Eurocurrency.

0 Comments

California and Mandatory Solar Panels

7/30/2018

1 Comment

 
Picture
​  To paraphrase Tom Cruise from the movie, A Few Good Men, I don’t know if it ranks amongst the most Galactically Stupid pieces of Legislation, but it should be considered.  California has implemented a law that will require all new homeowners, to take effect in 2 years, to install solar panels on their newly constructed homes.  The California Utilities Commission estimates that it will add $12,000 to the price of a new home and it will shave an average of $40/month off of the average electric bill.  This will, inhibit the housing industry in California and obviously raise price when there is already a shortage of low cost housing in California.  State officials and clean-energy advocates, stated that the extra cost to home buyers will be more than made up in lower energy bills.  I will disagree and can’t help but wonder if any one did the math?  A $12,000 cost, divided by $40/month savings equals 300 months until breakeven, or 25 years.  That’s correct, a 25 year breakeven.  In the businesses I’ve owned, whenever I made a capital investment, I’m looking for a much quicker ROI, 1-5 years depending on the investment.  In a recent study by the National Association of Realtors, has increased from 6-9 years in 2016.  According to the study, the reason for this was the crash in home prices that took many potential sellers off the market.  It is estimated that in the next 10 years, this may revert to 6-7 years as equity in homes, and prices, increase.  To sum quickly, it’s a poor investment since I don’t believe the solar panels on a home will cover their cost when the house is sold.  In addition, California already has amongst the highest electric rates in the US and this will exacerbate that cost (Chart).  Also keep a mind, the estimated useful life of a solar panel is 25-30 years.  It is a terrible investment.

Picture
​Some facts about photo voltaic panels that environmentalist keep to themselves.  Within the 1st 6 months, they will lose 15% of their generation capacity; i.e., under peak circumstances, a June/July day with no clouds you will only generate 85% of capacity.  In other words, if you have a typical 5 kilowatt system, the most that can be generated is 4,250 watts.  In the winter, with shorter days and the sun lower in the sky (not to mention more clouds and snow on the panels), you can plan on generating about 25-33% of what you generate in the summer.  Also, the solar cells within a panel are connected in series.  Therefore, if one of the cells is partially blocked in the panel (e.g., by a leaf), the panel loses 95% of its generating capacity.  Think Christmas tree lights, one goes out, they all go out.
  Lastly it is not totally clean energy.  According to environmental progress.org, 
• “Solar panels create 300 times more toxic waste per unit of energy than do nuclear power plants.
• If solar and nuclear produce the same amount of electricity over the next 25 years that nuclear produced in 2016, and the wastes are stacked on football fields, the nuclear waste would reach the height of the Leaning Tower of Pisa (52 meters), while the solar waste would reach the height of two Mt. Everests (16 km). 
In countries like China, India, and Ghana, communities living near e-waste dumps often burn the waste in order to salvage the valuable copper wires for resale. Since this process requires burning off the plastic, the resulting smoke contains toxic fumes that are carcinogenic and teratogenic (birth defect-causing) when inhaled.

  Once again, California appears to suffer from mental myopia, but at least they are consistent.
   

Picture
1 Comment

Are Low Oil Prices here to Stay

5/4/2018

0 Comments

 
Picture
​Spoiler alert, foregoing any shock to the economy, such as a large bomb exploding or a war that disrupts oil flow, yes they are here to stay compliments of US fracking technology.  If you look at the two charts below, they show the price of oil in nominal dollars and then adjusted for inflation in 2017 dollars.  To put it in perspective, $1 in 1973, the 1st oil crisis, has the same purchasing power as $5.51 now.  So if a barrel of oil was selling for $7.85 then, it would be akin to $43.25 now.  The question that comes to mind should then be, what do I consider to be low oil prices.  In today’s dollars and cents, anything under $75-$80 I feel is reasonable and low by historical standards.  The highest that oil has ever been was $147 in 2008 or $167 in 2017 prices and gas at the pump was above $4 for a gallon of regular.  A general rule of thumb is every time that the price of oil/barrel changes by $1, it equates to 2.5 cents at the pump.  Before we go any further some statistics and information on oil.

​   Worldwide oil demand is a little over 100 million barrels/day and supply is slightly more.  US oil demand is about 1/5 of that at 20 million barrels/day, and as a result, the US is a net exporter of oil.  The largest oil producer (see chart) is Russia at 11 million barrels per day followed by the US at 10.62 and Saudi Arabia at about 10.  Saudi Arabia is capable of producing more, but they have reduced production as part of a voluntary OPEC cutback to prop up prices.  

  More background on oil and production.  In the 1956, Marion Hubbert, an American Geologist came forth with a theory concerning a countries oil production hence known as Hubbert’s Peak.  Hubbert stated that fossil fuel production for a country would follow that of a normal bell shaped curve.  It will increase at an increasing, then increase at a decreasing rate, reach a peak and then decrease.  The ultimate conclusion is that we (the world) will ultimately deplete fossil fuel and al alternate source is needed.  If you look at the charts below for Norway, China and the US, it follow the theory perfectly.  However, along comes fracking technology and within 10 years, we have doubled the production of US oil.  Production is expected to increase, particularly as oil remains above $60, and  we are expected to surpass Russia as the number 1 producer of oil in the world.  The EIA (Energy Information Agency) has stated that we have proven oil reserves of over 35 billion barrels and from the US Geological association, over a trillion barrels of remaining reserves and the EIA is lower at 200 billion. 

    Given the above, I see continuing cheap oil in the foreseeable future.
0 Comments

What Kills Bull Markets

1/17/2018

0 Comments

 
Picture
Picture
​The longest Bull Market in Wall street history (since the Dow’s inception in 1896, was the 1950's and in recent times,  from 1987-2000 and we are currently in the 2nd longest recession which began in March 2009 after the Dow’s low of 6,470.  At the time of this writing, the Dow is skirting the 26,000 level; an amazing increase of 402% in 9 years, an average return of 17%/year (to do this on excel, you would use the rate function under the formula tab).  It hasn’t been a constant 17% and last year alone, the Dow advanced nearly 25% compliments of Trumponomics and the new tax structure which reduced the corporate income tax rate from 35% to 21%.  What kills a bull market is quite simply a bear market.  When the Dow, or any index retreats 10% from it’s highs it’s referred to as a correction, and when it retreats 20%, it is no long a bull market and it is now a bear market.  What then, you ask, causes a bear market.  Quite simply, it is either a recession of the FED.

Picture
        First, the FED.  The FED is often accused of taking away the punch bowl just as the party is at its wildest.   If asked, some analysts would say that the FED’s enemy number 1 is inflation.  This is technically, not the case.  Enemy number one is generally deflation since it is always indicative of a lack of aggregate demand.  This happened during the last recession between 2008-2009 when prices went down by over 2%, and the last time before that was 1950, and the time before that, the great depression.  However, it is so infrequent in recent economic history, the main issue has become inflation.  The FED steals the punch bowl (i.e., battles inflation) by raising interest rates, which makes borrowing more expensive, and reducing the money supply (by selling government bonds) which also has the effect of increasing interest rates.  An extreme example of the FED raising rates, and in this case causing a recession, was the 2nd dip of the double dip recession of the early 1980’s.  This was the worst recession since the great depression due to the fact it was extreme stagflation.  Mortgage rates soared to over 20%, which destroyed the housing market, and the unemployment rate soared to 10.8%, the highest since the depression, and remained above 10% for 8 months.  The economy was suffering from stagflation, a stagnant economy and high inflation, and the FED knew that if it battled inflation, it would send the economy into a recession.  However, they made the determination that a low inflation rate, their target is generally 2-3%, is consistent with all long term economic goals and after inflation was brought under control, the economy and the market recovered.

​   Recessions are determined by the National Bureau of Economic Research (NBER).  Contrary to what most Principles book teach, a recession is two consecutive quarters of negative GDP, this is not the case.  NBER defines a recession as “a significant decline in activity, spread across the economy, lasting more than a few months, visible in industrial production, employment, real income and wholesale-retail sales.  It is prolonged, protracted and pervasive.”  
Picture
Picture
​A while back, one of my students asked me what causes recesiions.  The text book answer to that question is shocks to the economy; ah but there’s the rub (I’m sure Shakespeare is rolling in his grave), what causes those shocks?  My answer was 1 word, greed.  An unlike the movie Wall Street’s antagonist, Gorden Gecko, greed is not good.  If you look at the past 4 recessions, greed is the root.  The financial crisis recession was caused by the bubble bursting in the housing market, where prices in some areas were going up by 30%/year; the 2001 recession was the dot com bust, according to one analyst on CNBC, the number of dot com companies shrank from 30,000 to 5,000 and the NASDAQ dropped from 5000 to just over 1000; the 1991 recession, a mild one, was caused by the oil price shick of Iraq invading Kuwait, and the double dip recession of the 1980’s was a result of high commodity prices that plunged after the FED’s intervention.
So, you ask, how long will this bull market last?  Good luck on predicting that, but as long there is no unforeseeable shock (such as a big bomb going off somewhere), I don’t see any end to this in the next 3-6 months.  The corporate tax cut increases corporate profits by over 20%, and the reduction in regulation that Trump has accomplished by Executive Order, including the construction of the Keystone pipeline, has also saved corporate dollars.  So with the Dow rising 25% last year, it’s indicative of a fairly efficient market.  If I should see and storm clouds on the horizon, you’ll be the 1st to know.
    

0 Comments

How the new Tax Bill affects you

12/21/2017

2 Comments

 
Picture
​   Depending on who you are listening to, it’s either financial Nirvana or Armageddon.  The partisan new tax bill will have far reaching effects.  What I’ve done this month is break down on how it will effect various income groups.  I’ve calculated what various incomes will pay under the old tax structure and the new republican tax bill.  The parameters I’ve chose are for married couples who make $55,000 (the national average), $150,000, and $750,000. 
The attached chart is the old tax structure and the computations are as follows (the assumptions are that you don’t itemize deductions and you have 1 dependent child):

For $55,000 & married:
OLD RATE
   The standard deduction is $13,000 and as a result, this is subtracted from your combined income and as a result, you are taxed on only $42,000 of income.
              Tax Rate                                          Tax paid                            Total Tax Liability
the 1st 17,850 is taxed at 10%                   1,785
17,851-42,000 is taxed at 15%                  3,622                                
Child tax credit                                             -1000                                 4408
 
NEW RATE
The standard deduction is doubled to $24,000 and
as a result this couple is taxed on only $31,000 of
income.
              Tax Rate                                          Tax paid                            Total Tax Liability
the 1st $19,050 is taxed at 10%                 $1905
19051-42,000 is taxed at 12%                   2754
Child tax credit is doubled                         -2000                                 $2659
              This represents a decrease of 39.7%
 
​

For 150,000 & married:
OLD RATE
              Tax Rate                                          Tax paid                            Total Tax Liability
the 1st 17,850 is taxed at 10%                   1,785
17,851-72,500 is taxed at 15%                  8120
72,501-146,500 is taxed at 25%                18,500
146,501-150,000 is taxed at 28%              980
Child tax credit                                             -1000                                 28,385
 
NEW RATE
the 1st 19,050 is taxed at 10%                    1905
19,051-77,400 is taxed at 12%                  7002
77,401-$150,000 is taxed at 22%              15972  
Child tax credit                                             -2000                                 22,879
              This represents a decrease of 19.4%
 
 
For 750,000 and married
   This becomes a little more difficult since many of the deductions the rich have are going to be decreased and this will hurt them (but not that much).  As a result, I’m calculating the taxes on AGI, Adjusted Gross Income, i.e., income after deductions.
OLD RATE
              Tax Rate                                          Tax paid                            Total Tax Liability
the 1st 17,850 is taxed at 10%                   1,785
17,851-72,500 is taxed at 15%                  8,120
72,501-146,500 is taxed at 25%                18,500
146,501-223,050 is taxed at 28%              21,434
223,051-398,350 is taxed at 33%              57,849
398,351-450,000 is taxed at 35%              18,078
451,001-750,000 is taxed at 39.6%          118,800
Child tax credit                                             -1000                                 244,566
 
NEW RATE
the 1st 19,050 is taxed at 10%                    1,905
19,051-77,400 is taxed at 12%                  7,002
77,401-165,000 is taxed at 22%                18,272
165,001-315,000 is taxed at 24%              36,000
315,001-400,000 is taxed at 32%              27,200
401,000-600,000 is taxed at 35%              70,000
601,000-750,000 is taxed at 37%              55,500
Child tax credit                                             -2,000                                213,879
              This represents a decrease of 12.5%
 
              As you can see, there are tax savings across the board with the largest % tax breaks going to the lower income groups.  It will also simplify the tax code by increasing the personal tax deductions.  As a result, more households will file the short form (i.e., they will not itemize deductions) and this can represent savings from a tax preparer.  As an economist, I feel simplifying the tax code and lowering the tax rate is an excellent step.  However, it is projected to increase the deficit by $1.5 trillion dollars which given our existing debt, over $20 trillion, is a move in the wrong direction.  This tax cut should also have been accompanied by spending cuts.
 
 How much do you have to make to be in the top 1%? This differs by web site, but the IRS states that to be in  the top 1% for 2014, you had to have AGI of at least  $465,246.  Also from the IRS, the top 1% paid 45% of all income taxes collected by the federal government in 2015.


2 Comments

Everything you want to know about 401K

11/8/2017

0 Comments

 
Picture
​  With the presidents new tax plan that’s being released, there is a combination of concern and exuberance.  Some of the questions I’ve been getting have centered around the many retirement plans in general and the 401K in particular.  What I’ve learned is that many people have little knowledge of the various plans.  In this month’s blog I’ll go over the major points of some plans.
  First, the 401K.  It’s so named because of the section of the tax code that sets forth the criteria.  It’s probably the most popular plan and I advise my students to try and find a job that offers it as a benefit.  The plan is sponsored by an employer and involves pre-tax income that allows you to contribute to the plan which your employer matches to some extent.  The money you contribute is generally a percentage.  For instance: if you make $1000/week, you may elect to take out 10% in which case you are taxed on only the remaining $900.  Your employer, especially private sector will contribute usually, anywhere from 2-5%.  Rarely have I seen it higher than that amount.  However, your maximum contribution is limited to $18,000/year, and there is a combined contribution limit of $53,000 for the employer and employee.  
  You then get to pick the type of investments you want that range anywhere from very conservative to aggressive.  The younger you are the more aggressive (growth stocks) you should be.  Keep in mind, the average return for the S&P 500 from 1950-2010 has been 11% which far eclipses any bond fund.  To oversee your account, your employer usually hires an administrator such as Fidelity Investments.  You can increase or decrease your contributions at any time and you should elect a beneficiary (If you’re married, your spouse is automatically the beneficiary.)

Picture
​​   You may withdraw your money at any time (not advised prior to retirement) and it is taxed at your current tax bracket.  However, if you withdraw it prior to 59 ½, the IRS also tacks on a 10% penalty.  The purpose is to discourage that behavior; but there are some exceptions to the early withdrawal penalty.  
These exceptions are hardship withdrawals.  A hardship withdrawal is “made on account of an immediate and heavy financial need of the employee,” according to the IRS.  A letter must be written to IRS outlining the hardship/need.  Some examples are: medical payments, college tuition,  down payment on a primary residence, or to prevent foreclosure of a residence.
Lastly, at age 70 ½, there is a mandatory withdrawal (attached chart).  To compute the mandatory withdrawal, divide the balance in your 401K by the distribution period in years next in column 1.  For Instance fi you are age 70 and have $500,000 in your 401K, your mandatory withdrawal would be $500,000/27.4 or $18,248.18; and yes, if you start saving early you can easily have 6-7 figures by the time you retire.

0 Comments

Minimum Wage Revisited

9/26/2017

0 Comments

 
     ​  The minimum wage is always in the news, hover in the past year there has been a push for a $15/hour federal minimum wage.  As those of you who follow me can probably guess, I think, on a particularly good day, this is ludicrous. 
   First of all, let’s look at the cost to the employer. In addition to the pay to the employee, the employer must pay the following:  Social Security of 6.2%, Medicare of 1.45%, Workers comp Insurance (which differs by state), but in Ma it’s $1.74/hour, Unemployment Insurance, in Ma, 1.87%, sick benefits and medical benefits for a total cost of $21.90/hour. A significant amount and it’s no wonder that McDonalds is replacing 2500 cashiers nationwide (there’s already 500 in Ca) with self-serving Kiosks (http://fortune.com/2016/11/18/mcdonalds-kiosks-table-service/).
  Let’s continue and look at some minimum wage statistics and they are as follow from the Bureau of Labor statistics:
-3.3% of workforce at min wage or less
               -4,8 million
              -5.2% 2007
              -13.4% in 1979
30% of min wage workers 16-19  (see chart below)
54% < 25
3% women min wage
2% men
Highest % in leisure and hospitality  15% (doesn’t take into account tips)
 
              Clearly the number of workers making minimum wage aren’t primary supporters of a household and if you’re a teenager with no education or experience, you’re lucky to be making a minimum wage.
 
  Probably the most damming evidence against a minimum wage comes from an article in the Washington Post (a very liberal newspaper) from a study by the University of Washington (a liberal college)
https://www.washingtonpost.com/news/wonk/wp/2017/06/26/new-study-casts-doubt-on-whether-a-15-minimum-wage-really-helps-workers/?utm_term=.0e3da87e38e4
 
   The findings of the study follow:
-Overall, employers cut their payrolls (layoffs)
 -reduced new hiring,
-reduced hours to low-wage workers
-The costs outweighed the benefits by a ratio of three to one
-the study estimates, the average low-wage worker in the city lost $125 a month because of the hike.
 
   The last comment I would like to make is on the mental myopia of a one size fits all minimum wage.  As you can see from the below chart, the cost of living varies differently across the United States, for instance, the state of NY has a cost of living 52% greater than Mississippi (higher if you just look at NY City) and having the Federal Government mandate the same minimum wage for both states defies reason.  However, at least Congress is consistent in that area.
 
0 Comments

What's Causing the Opioid Epidemic

7/25/2017

0 Comments

 
Picture
​In June, attorney Jeff Sessions, in a request to Congress, asked for authority to prosecute medical marijuana providers in the 29 states that have legalized it.  In a recent front page article, the Portland (Maine) Press, stated that this would affect 50,000 patients in the state alone.  It is estimated that there are close to 1.5 million nationwide (medicalmarijuana.procon.org).  I feel that this is a very myopic view of the AG based on what I believe is the incorrect assessment that it is a gateway drug.  A number of studies, has shown this is not the case and I will present a study that I recently performed.  In order to qualify for medical marijuana, in most states, you need to see a qualified doctor and obtain a written recommendation stating the benefits of cannabis therapy.  The doctor can’t give you a prescription since that is regulated by the FDA and it is still against federal law.  Medical marijuana has a number of uses ranging from chronic pain, anxiety, nausea and PTSD.  The strong case for medical marijuana is that it is used as an alternative/substitute for Opioids.  
  In my study, I looked at opioid deaths by state as the dependent variable and looked at 6 independent variables which were: per capita income by state, median age, unemployment rate, opioid prescriptions /100,000 population, incarceration rate/100,000 and a dummy variable for states that have legalized medical marijuana.  After performing a multivariate regression (chart), there was significance and strong evidence that the number of legal opioid prescriptions and incarceration rate play a significant part.  Simply put, the greater the number of opioid pain prescriptions will in turn lead to more opioid use.  This doesn’t require a large leap of intelligence since your major opioid scrips are for Vicodin, Percocet and OxyContin.  All of these are highly addictive and once the prescription expires, it is easier, and cheaper, to substitute heroin purchased on the street, which in turn leads to a downward spiral.  What dealers are doing is cutting the heroin with cheaper and more potent (50 times) fentanyl, which in turn has been leading to more deaths from overdoses.

Picture
  ​  The relationship between the incarceration rate and opioid use/death’s is significant and to no surprise, negative. In other words, as more people are in jail, overall opioid use/death decreases.  While they is some illegal drug usage in prisons, it is generally difficult to smuggle to the prisoners, and in turn use, hence the significance.  
  Another variable that showed some correlation, but did not reach significance, was the unemployment rate.  If someone is out of work, particularly long term unemployed (more than 26 weeks), depression and lethargy can set in which can lead to increased drug use.
  What is very relevant, is that there was no relationship between medical marijuana use and increased opioid use.  In a previous study I performed, there was some indication, but no statistical significance, that medical marijuana use could lead to decreased opioid use and deaths.  This can be illustrated by a recent study by Dr David Bradford of the University of Georgia, formerly of UNH (http://news.uga.edu/releases/article/medical-marijuana-lowers-prescription-drug-use-0716/ ).  For his study he used the statistics that are widely available from Medicare, and he found that in those states that legalized medical marijuana, there was less money spent on Medicare prescription drug use.  
    “The savings, due to lower prescription drug use, were estimated to be $165.2 million in 2013, a year when 17 states and the District of Columbia had implemented medical marijuana laws. The results suggest that if all states had implemented medical marijuana the overall savings to Medicare would have been around $468 million.

Compared to Medicare Part D's 2013 budget of $103 billion, those savings would have been 0.5 percent. But it's enough of a difference to show that, in states where it's legal, some people are turning to the drug as an alternative to prescription medications for ailments that range from pain to sleep disorders.  "The results suggest people are really using marijuana as medicine and not just using it for recreational purposes," said the study's lead author Ashley Bradford, who completed her bachelor's degree in sociology in May and will start her master's degree in public administration at UGA this fall.
To obtain the results, they combed through data on all prescriptions filled by Medicare Part D enrollees from 2010 to 2013, a total of over 87 million physician-drug-year observations.”  ( news.ugs.edu ).  
    What appears to be happening in these state are that Doctors are recommending medical marijuana in lieu of opiates and it is not only saving Medicare part D money, but is in no way a gateway drug.

0 Comments
<<Previous
Forward>>

    Author

    John Tommasi is a retired Senior Lecturer of Economics & Finance from Bentley and  the University of New Hampshire.

    Archives

    May 2020
    April 2020
    February 2020
    January 2020
    October 2019
    July 2019
    June 2019
    May 2019
    March 2019
    December 2018
    November 2018
    September 2018
    July 2018
    May 2018
    January 2018
    December 2017
    November 2017
    September 2017
    July 2017
    May 2017
    April 2017
    March 2017
    February 2017
    January 2017
    December 2016
    November 2016
    October 2016
    September 2016
    July 2016
    June 2016
    April 2016
    March 2016
    February 2016
    January 2016
    December 2015
    November 2015
    October 2015
    August 2015
    June 2015
    May 2015
    April 2015
    March 2015
    February 2015
    January 2015
    December 2014
    November 2014
    October 2014
    August 2014
    July 2014
    June 2014
    May 2014
    April 2014
    March 2014
    February 2014
    January 2014
    December 2013
    November 2013
    October 2013
    September 2013
    August 2013
    July 2013
    June 2013
    May 2013
    April 2013
    March 2013
    February 2013
    January 2013

    Categories

    All

    RSS Feed

Powered by Create your own unique website with customizable templates.
Photo used under Creative Commons from simone.brunozzi